Love charts and maps? You’re about to enjoy a lineup of intriguing data that turns stats into pure entertainment. These visuals don’t just explain; they surprise, amuse, and sometimes totally confuse. From bizarre correlations to unexpected trends, every chart tells a story you didn’t know you needed. Who knew spreadsheets could be this funny?
These 20 charts and maps transform ordinary info into witty, weird, and wonderfully intriguing data that’ll keep you scrolling. 10/24/2025


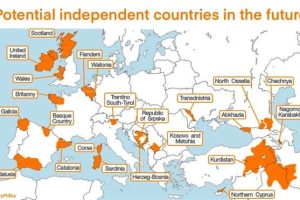
Take a look at more quirky charts and maps.


Add comment