KLYKER.COM
KLYKER.COM > COOL > Charts and Maps with Intriguing Data #208 (19 photos)

Charts and Maps with Intriguing Data #208 (19 photos)

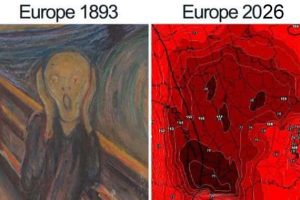
Some stories don’t rely on paragraphs at all, they show up through visuals shaped from raw numbers. When data is laid out in charts and maps, hidden details begin to surface. Subtle trends catch your eye, contrasts feel surprisingly amusing, and everyday subjects take on a fresh spark.

It doesn’t take much effort to appreciate it. One brief look at a graphic can reveal something unexpected or quietly entertaining.

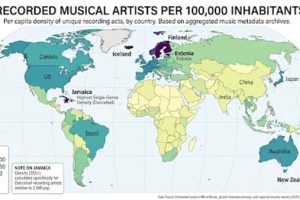
These 19 charts and maps with intriguing data transform ordinary facts into engaging, offbeat snapshots you’ll keep scrolling through without realizing the time. 5/15/2026

Charts and Maps with Intriguing Data #208 (19 photos)

Take a look at more quirky charts and maps.

🎲 Random Post | 🔗 Copy Link Copied! | 📡 Grab our RSS

Add comment

Follow Me on Pinterest