

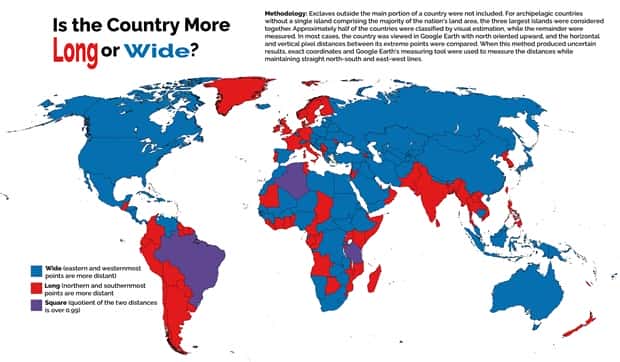
Not every rabbit hole starts with a video, sometimes it starts with a chart. One unusual graph leads to another, and before long you’re comparing odd statistics, spotting unexpected trends, and questioning facts you thought were obvious. It’s a reminder that even the most ordinary information can become surprisingly entertaining when it’s presented the right way.
Whether it’s a strange comparison or a map that reveals something unexpected, every visual offers a small surprise worth a second look.
These charts and maps with intriguing data serve up surprising facts, quirky patterns, and clever visuals that make scrolling easy. 7/10/2026
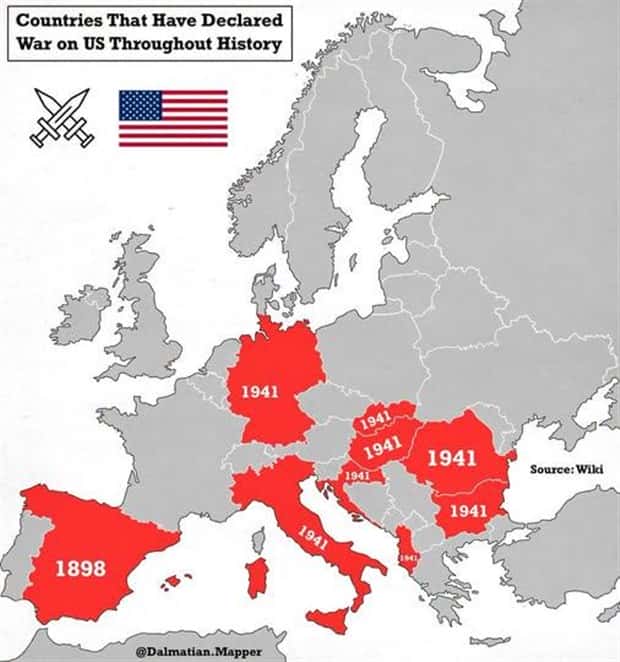
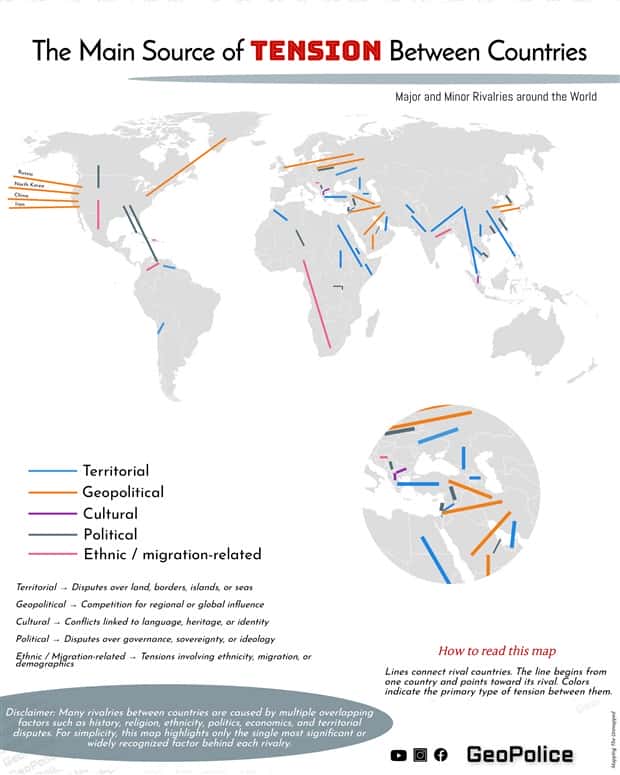
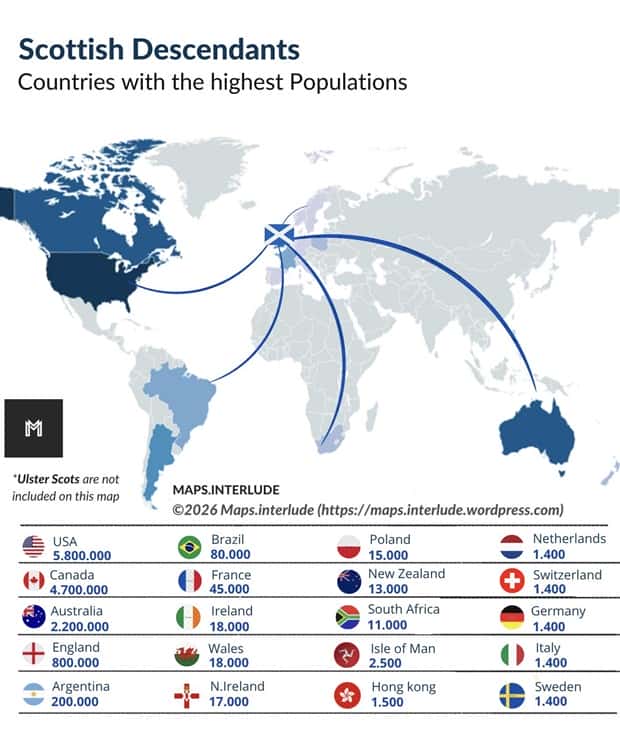

Take a look at more quirky charts and maps.



























Add comment