

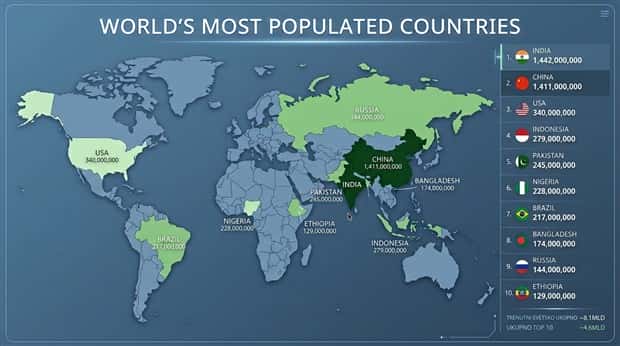
Charts and maps can turn even the most ordinary facts into something worth stopping for. Numbers that seem boring on their own can reveal strange habits, unexpected differences, and surprising patterns once they’re displayed visually. Some graphics explain things instantly, while others raise questions you never expected to ask.
From unusual statistics to fascinating comparisons, every visual has a little something that makes it worth a closer look. It’s quick, simple, and packed with those small details that can make you say, “I never knew that.”
These charts and maps with intriguing data turn everyday facts into surprising visuals that are fun, informative, and easy to scroll through. 8/28/2026
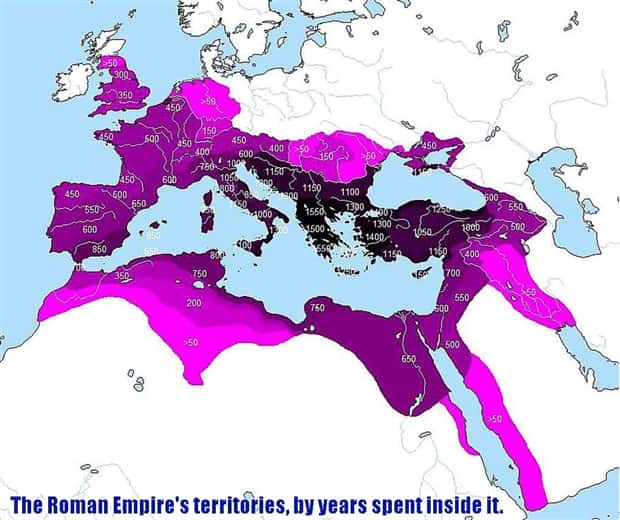
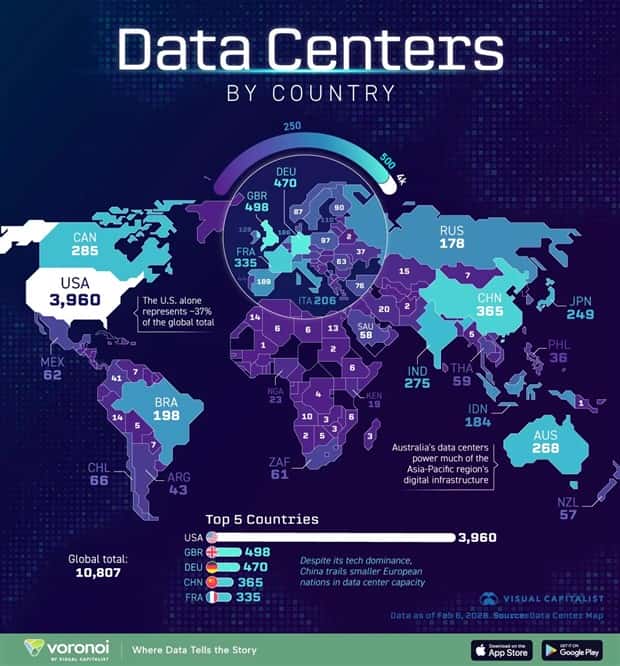
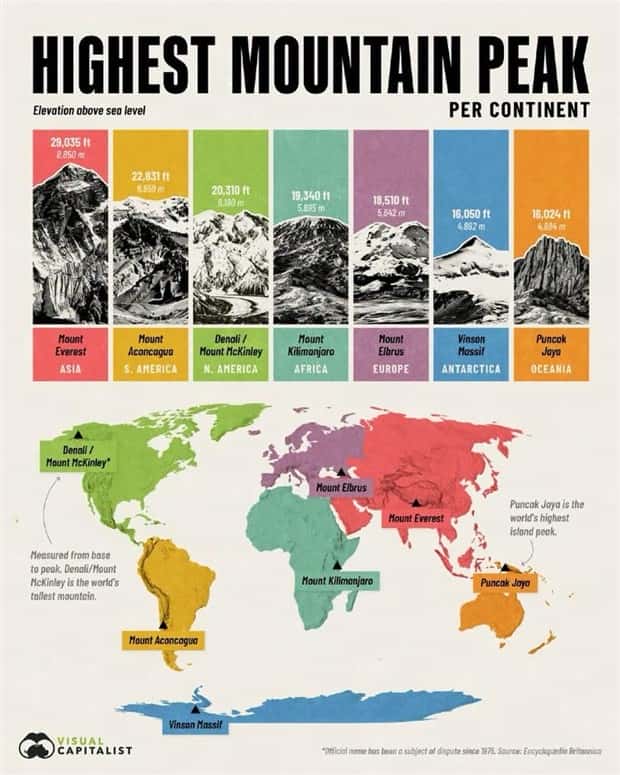
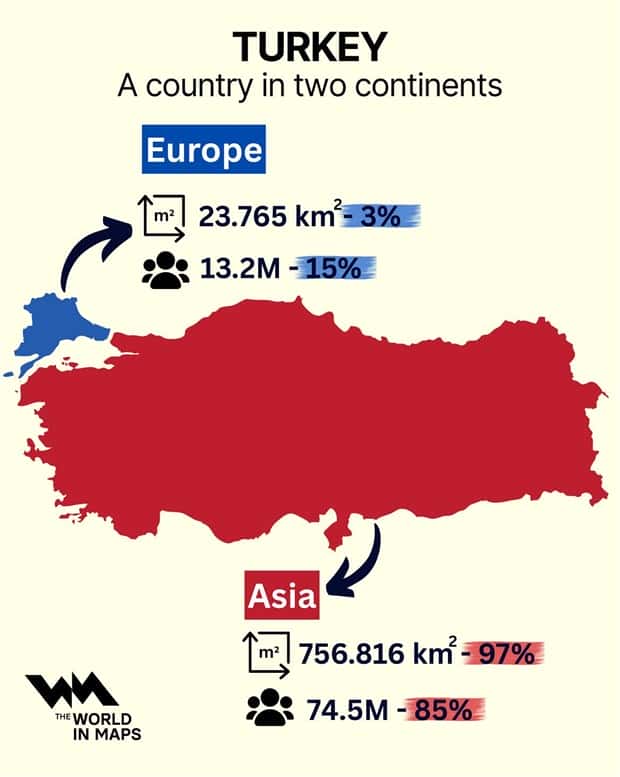
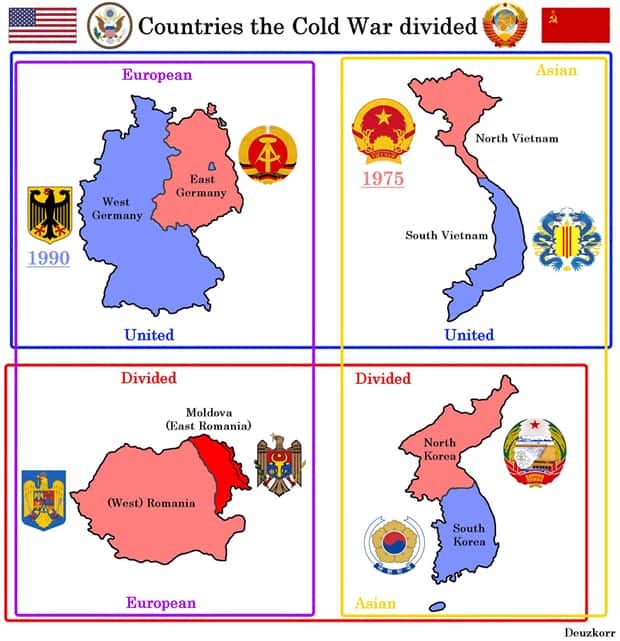
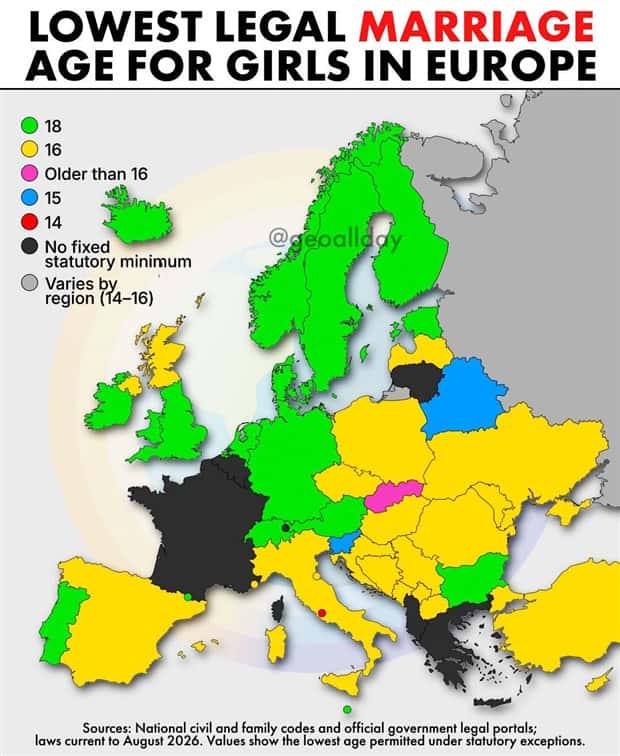
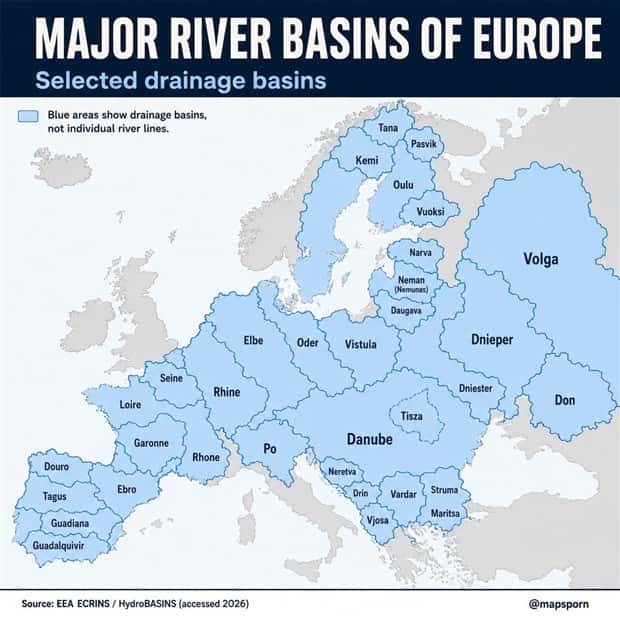
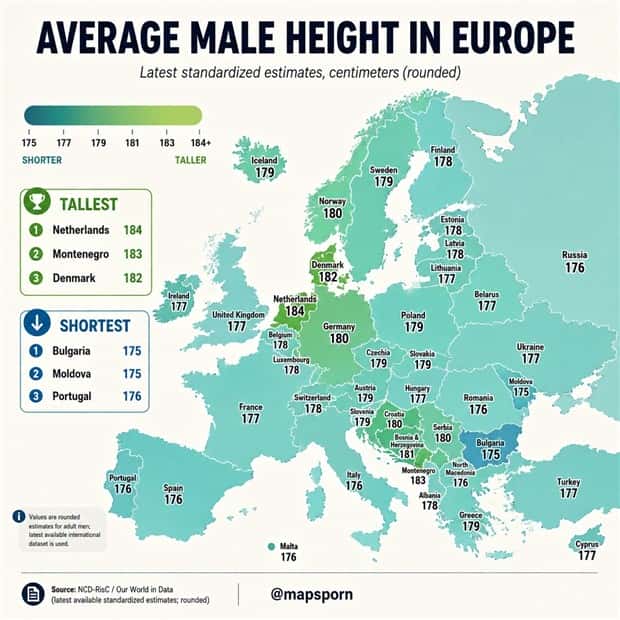
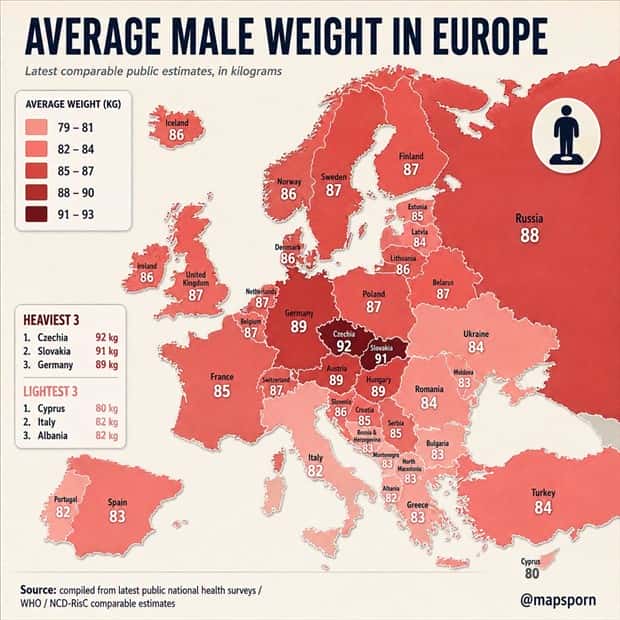
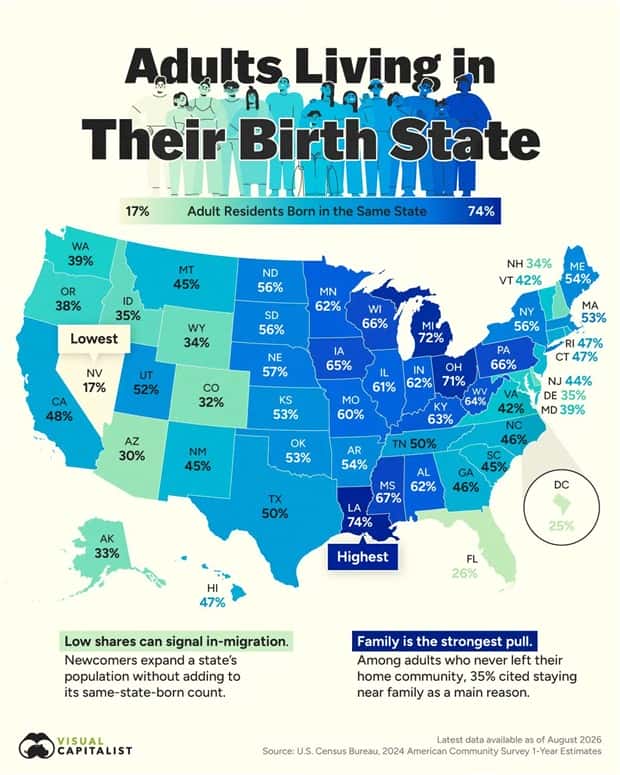
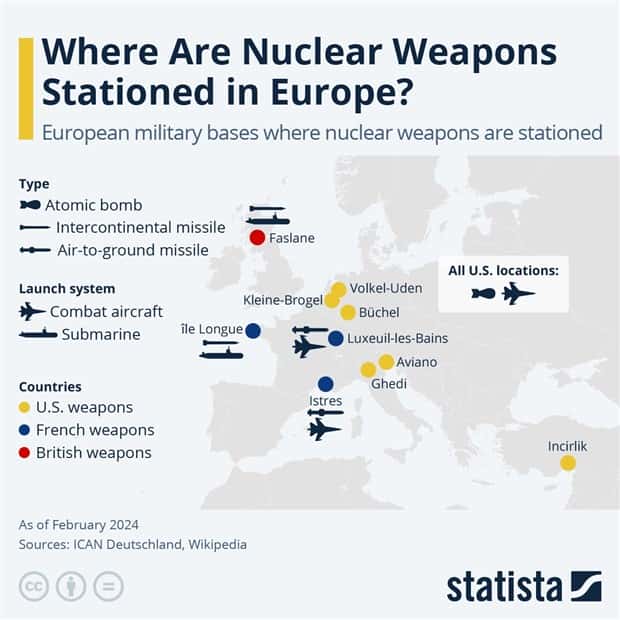
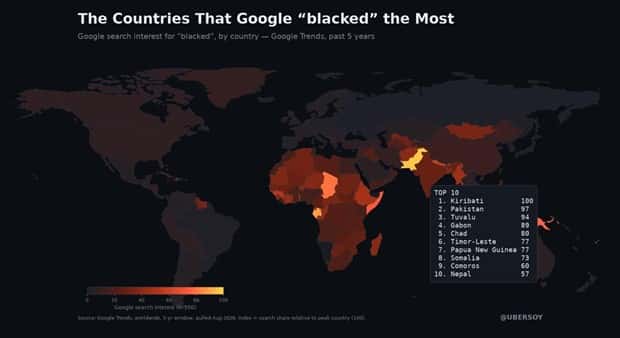
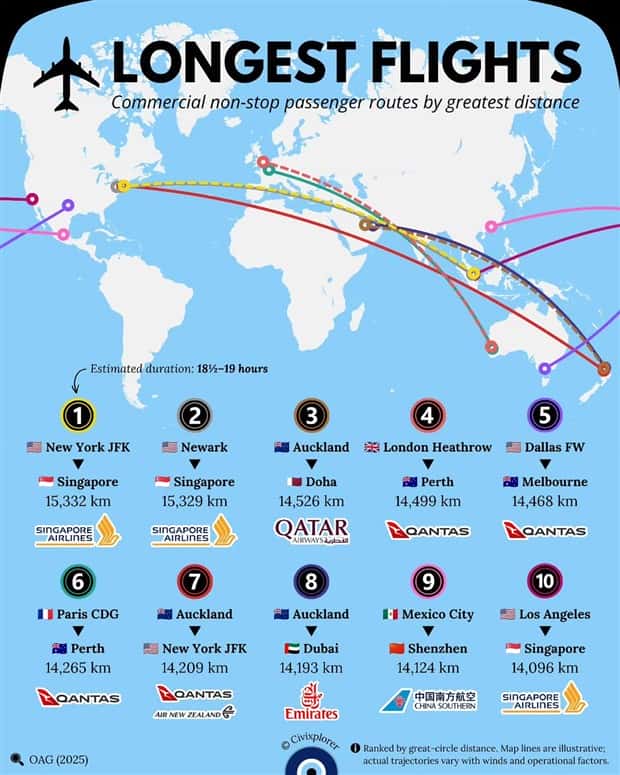
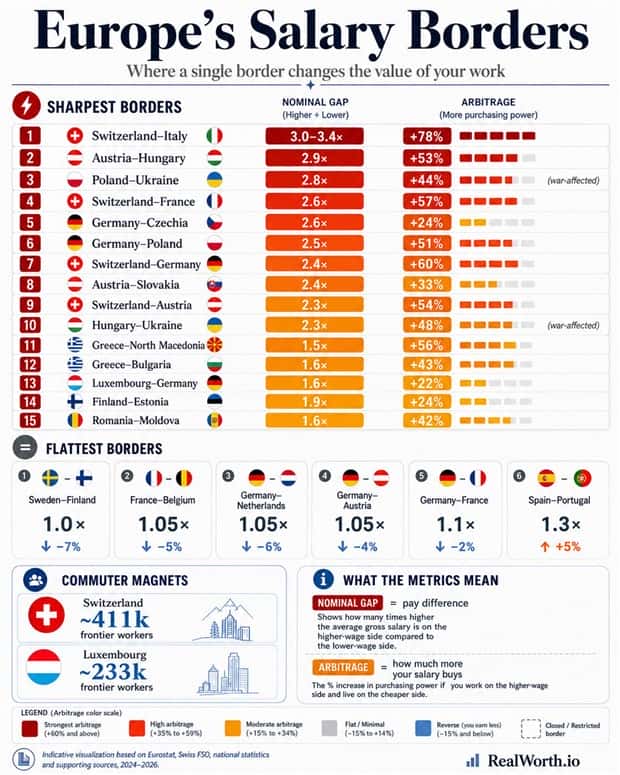
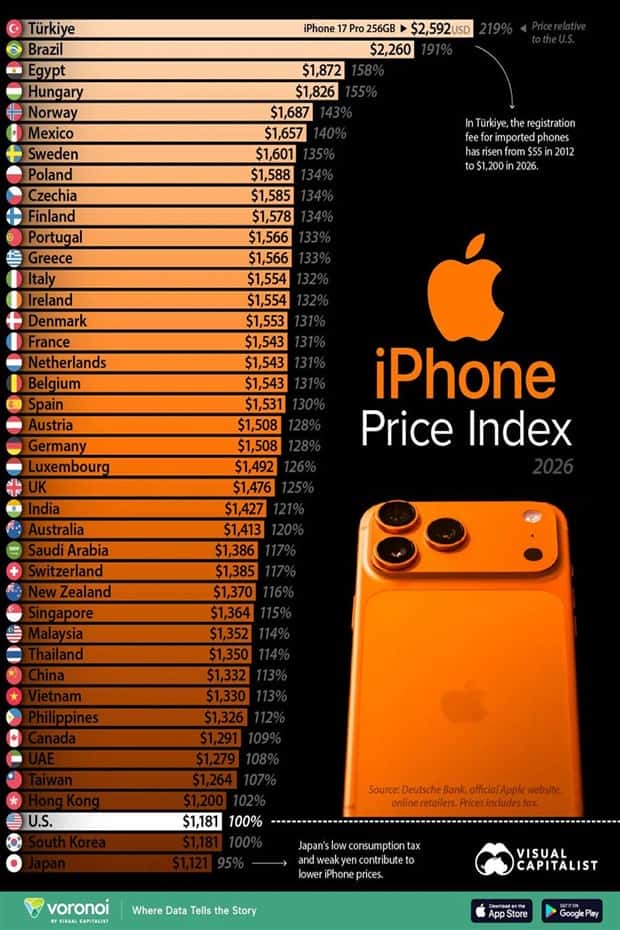
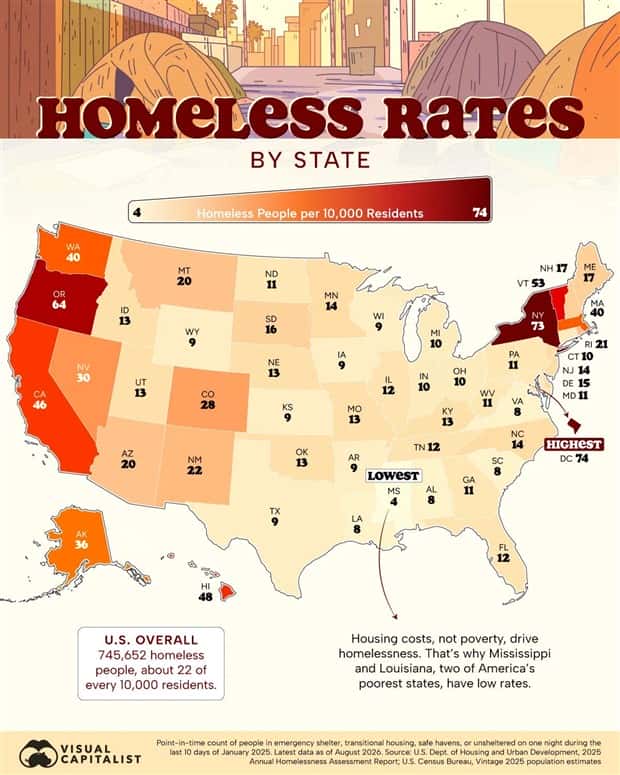
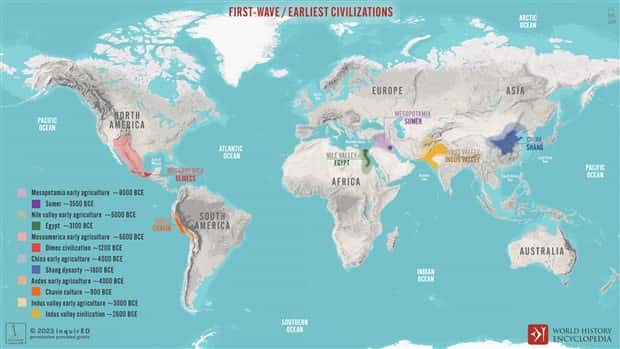
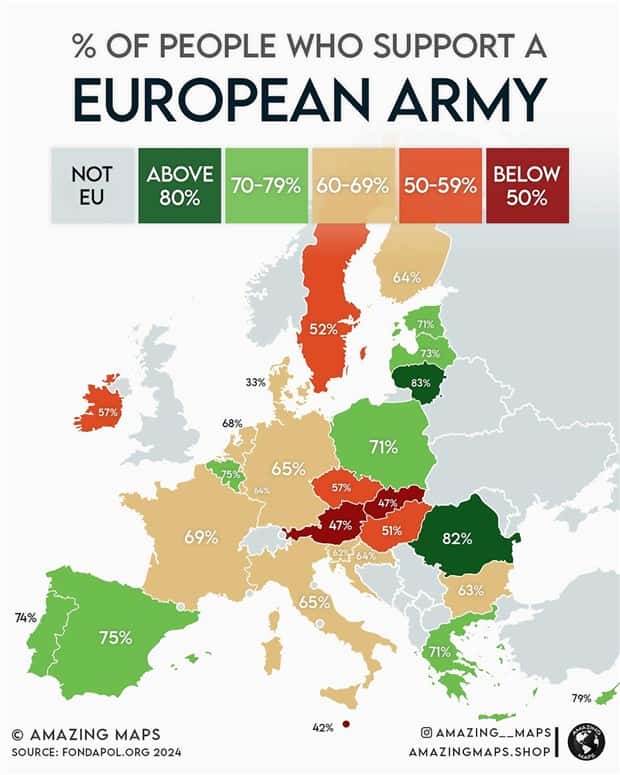
Take a look at more quirky charts and maps.



























Add comment