

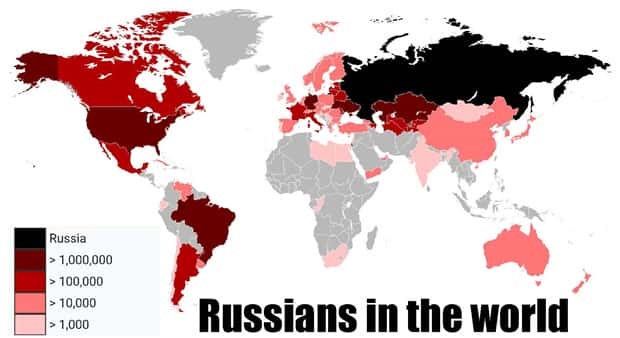
Numbers can be surprisingly entertaining when they’re presented in the right way. A clever chart or map can reveal unusual patterns, unexpected differences, and strange connections hiding inside everyday information. Suddenly, a simple statistic becomes something that makes you pause, smile, or take a second look.
Some visuals are instantly clear, while others leave you wondering how such an odd result is even possible. That mix of useful facts and unexpected details makes every graphic worth checking out.
These charts and maps with intriguing data turn ordinary statistics into fascinating visuals packed with surprising facts and quirky details. 9/4/2026
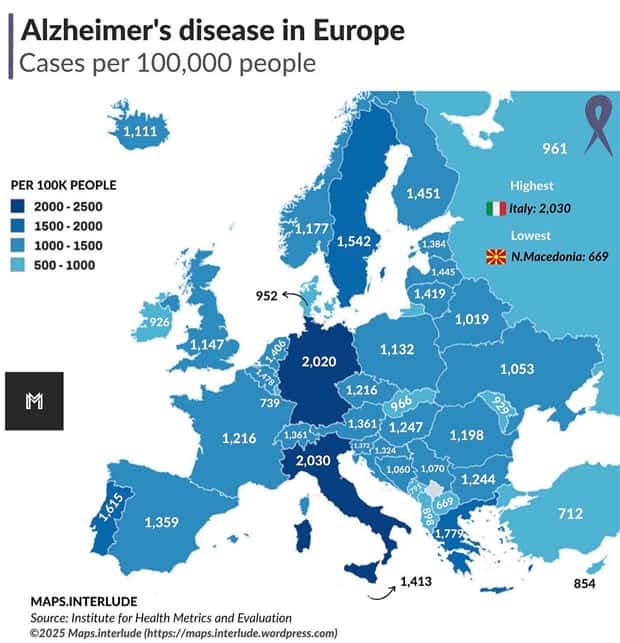
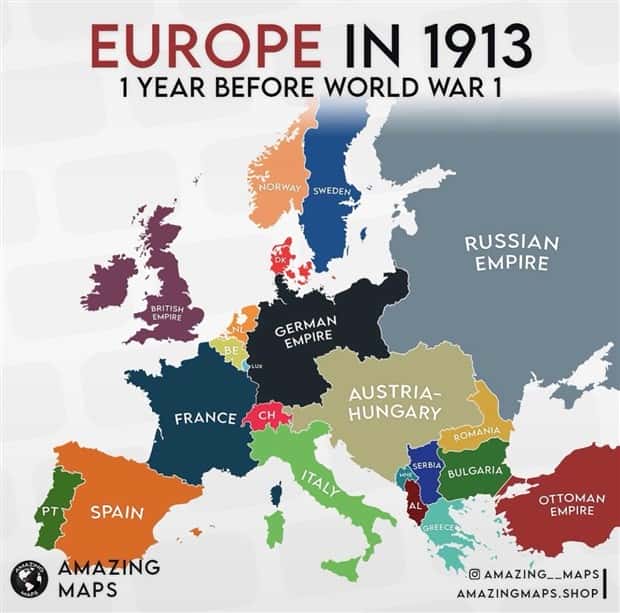

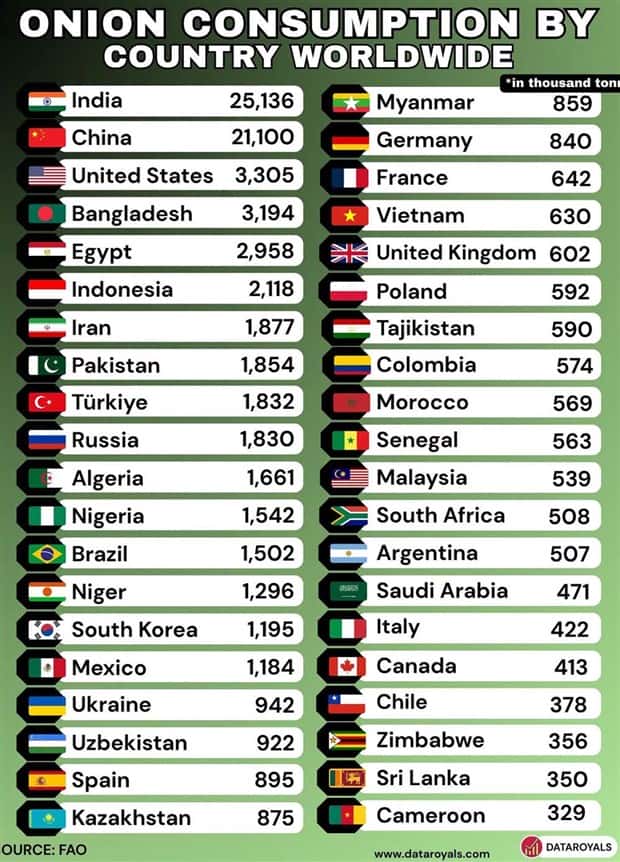
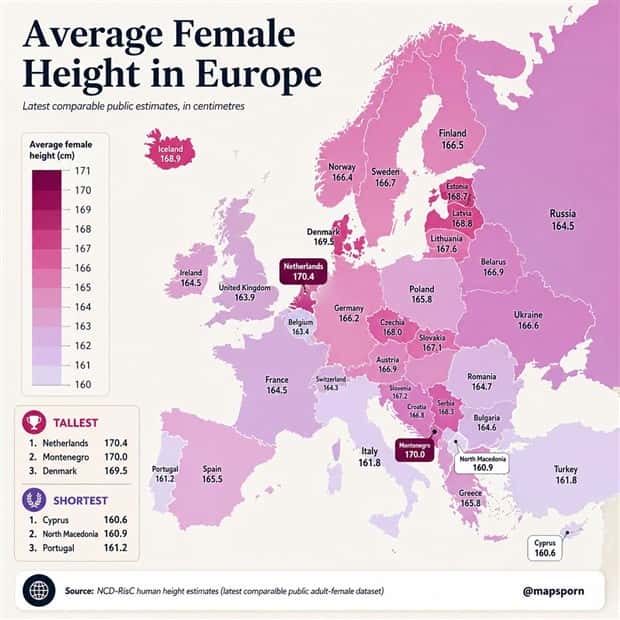
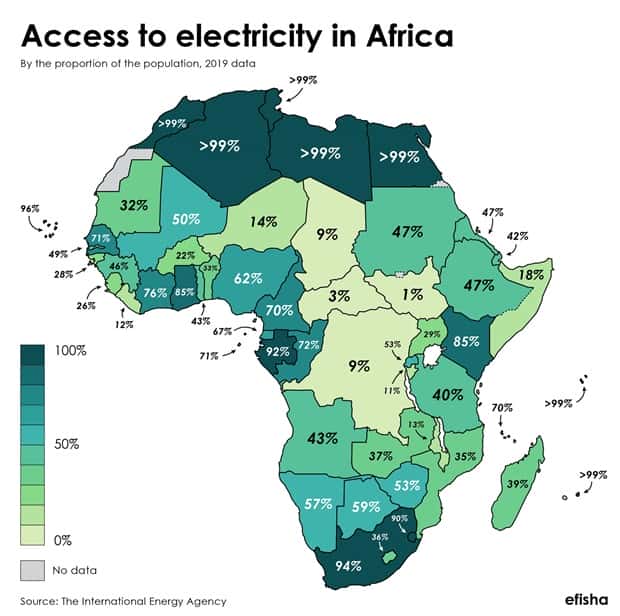
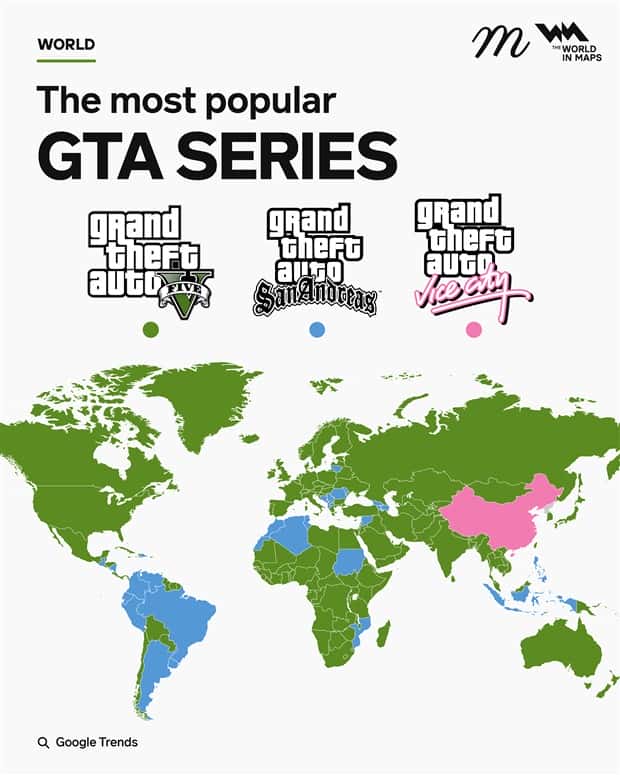
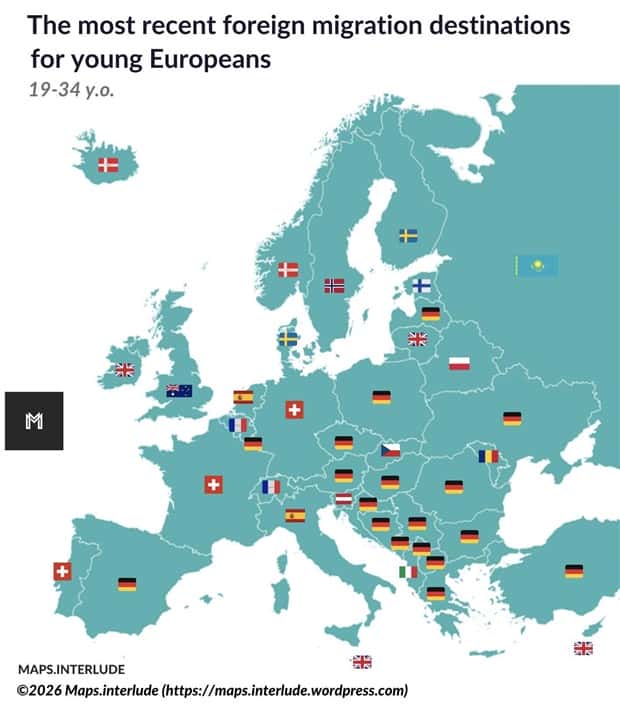

Take a look at more quirky charts and maps.



























Add comment