

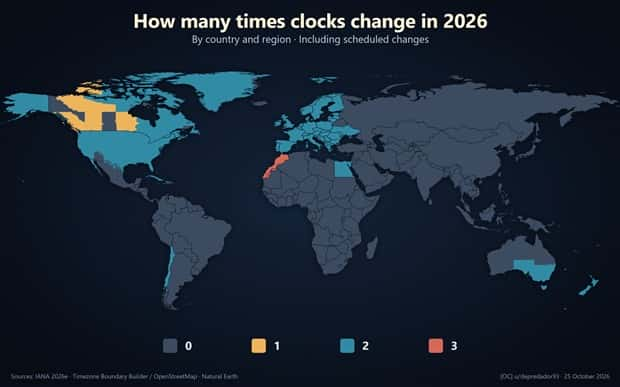
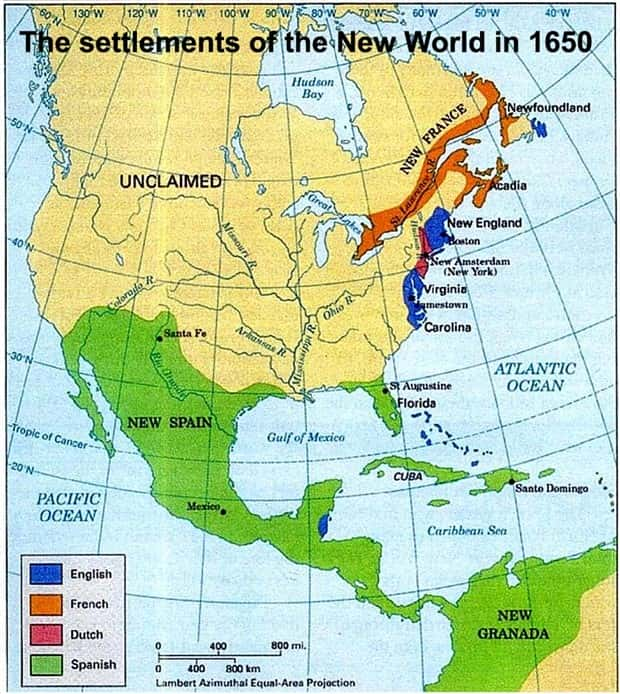
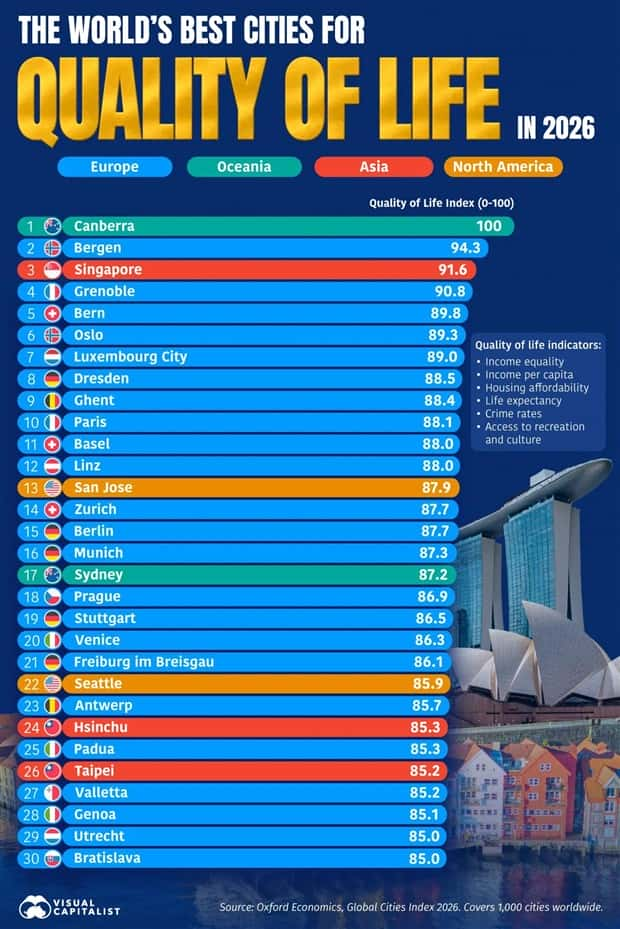
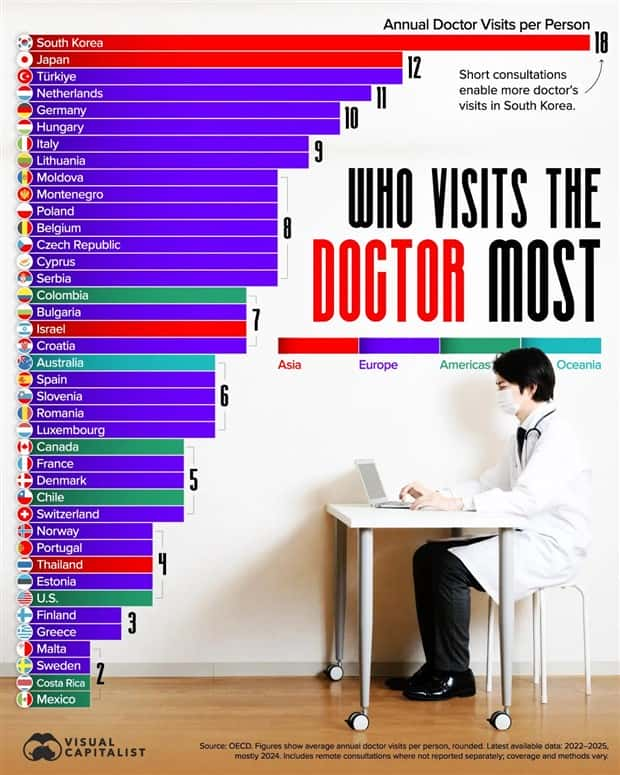
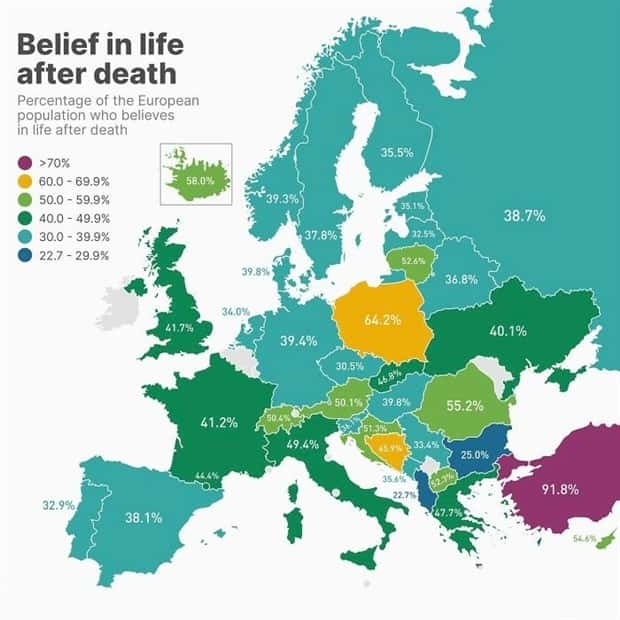
Some of the most captivating information is the kind that answers questions we never thought to ask. What makes a particular place so unusual? Which countries post the oddest numbers? Why do certain regions stand out in ways no one expected? Visualized data gives these curiosities a clear form, turning obscure details into something easy to grasp, with no lengthy explanations required.
The range of material is enormous, from quirky geographical oddities to statistics about how people behave. Some findings are genuinely practical, others are delightfully random, and a few may even shift the way you see the world.
Browse these charts and maps for a fresh batch of curious facts, surprising measurements, and visual discoveries worth sharing. 10/30/2026
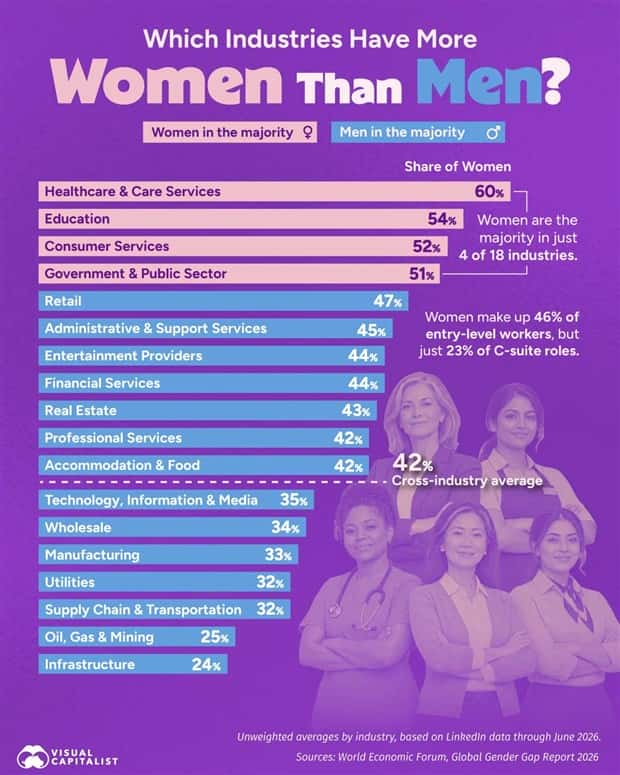
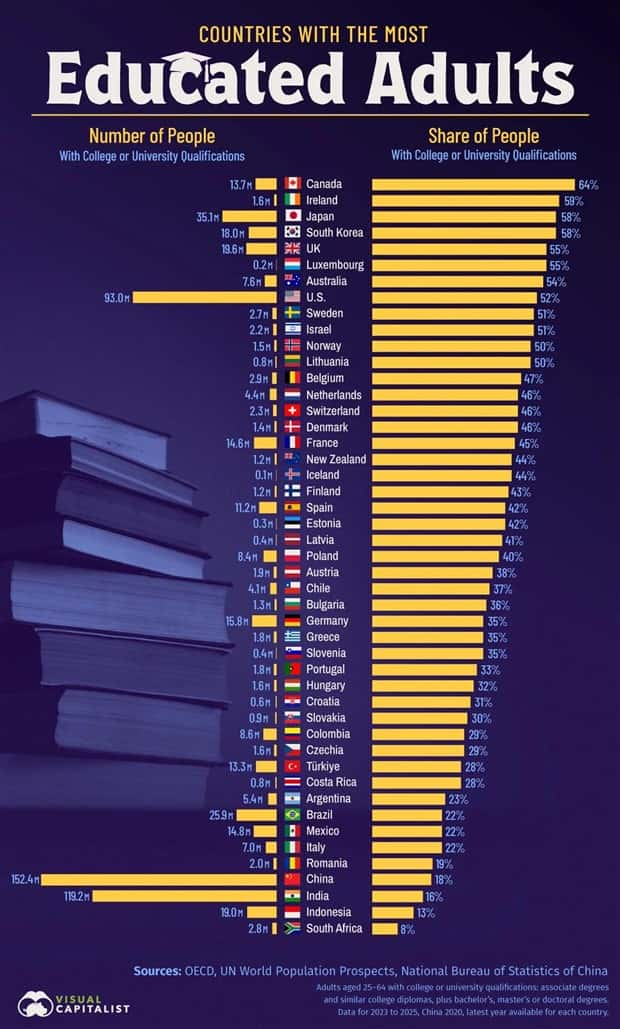
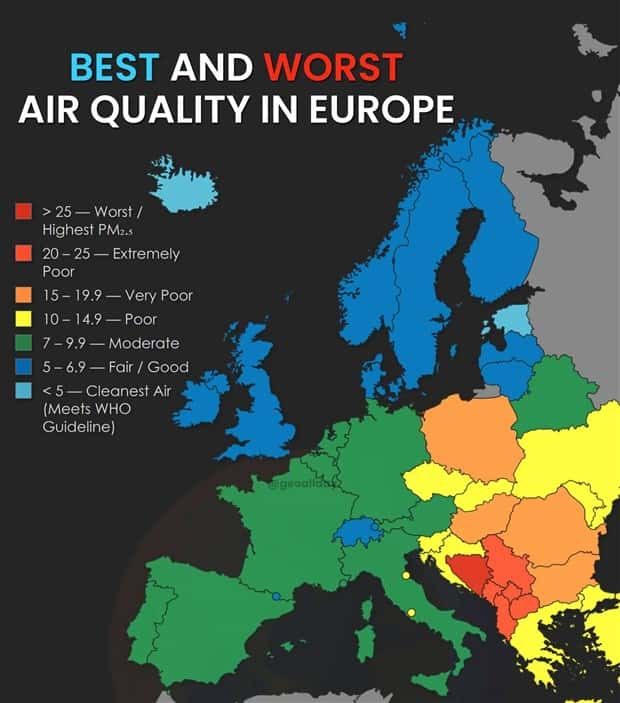
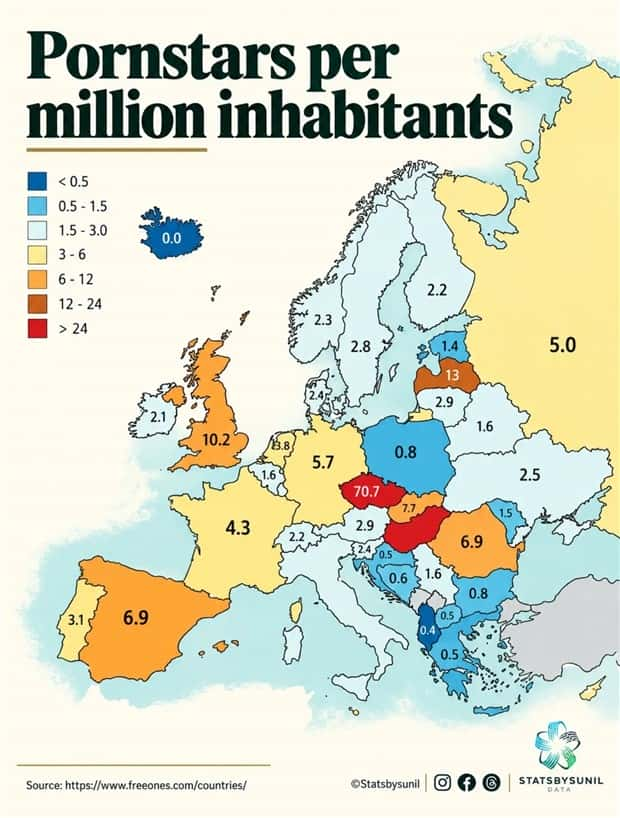
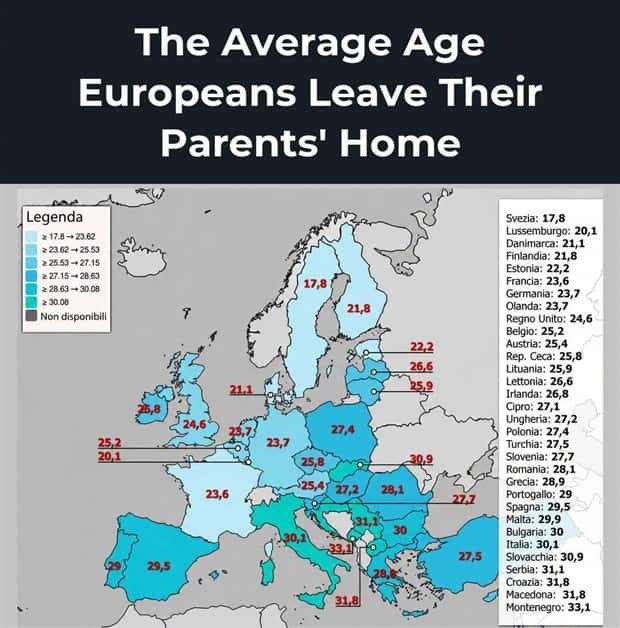
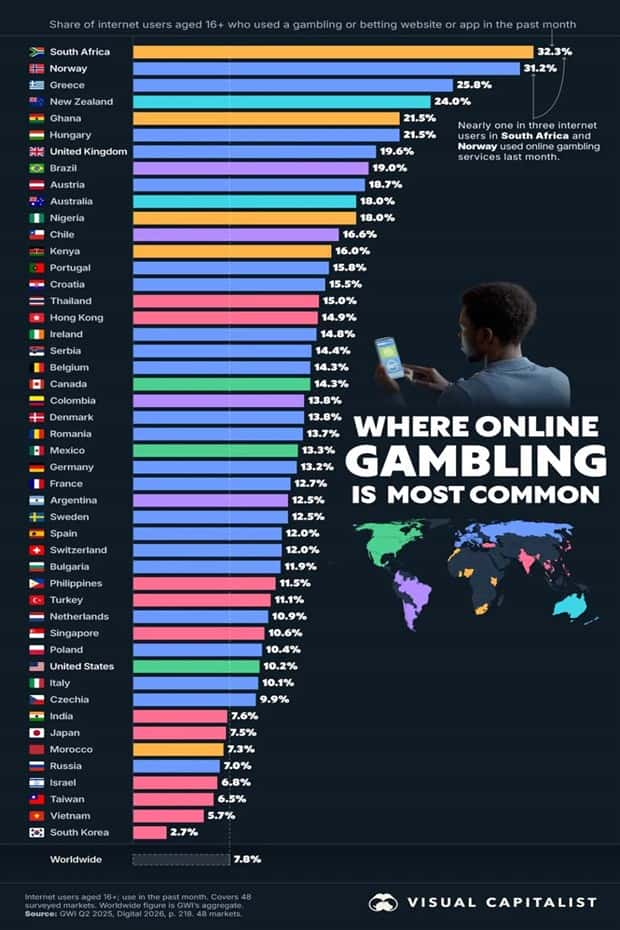
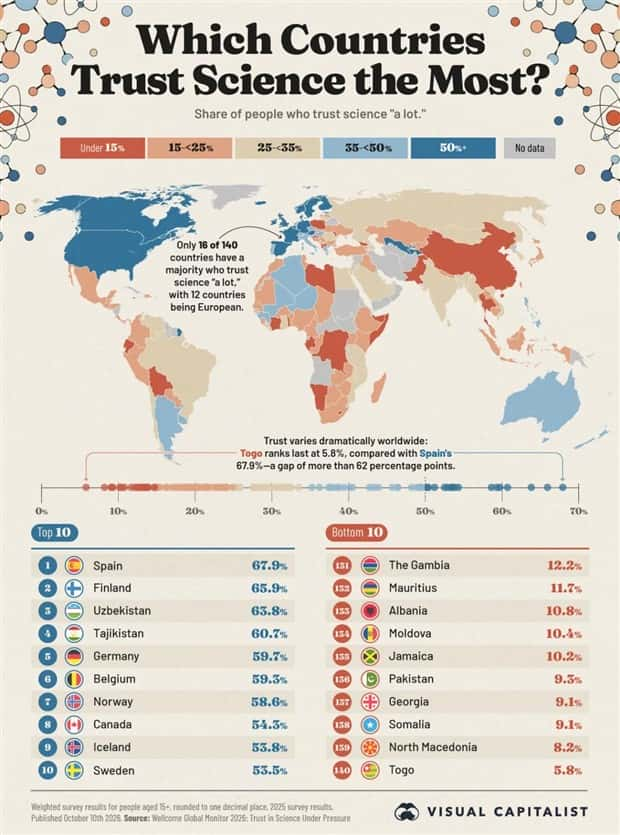

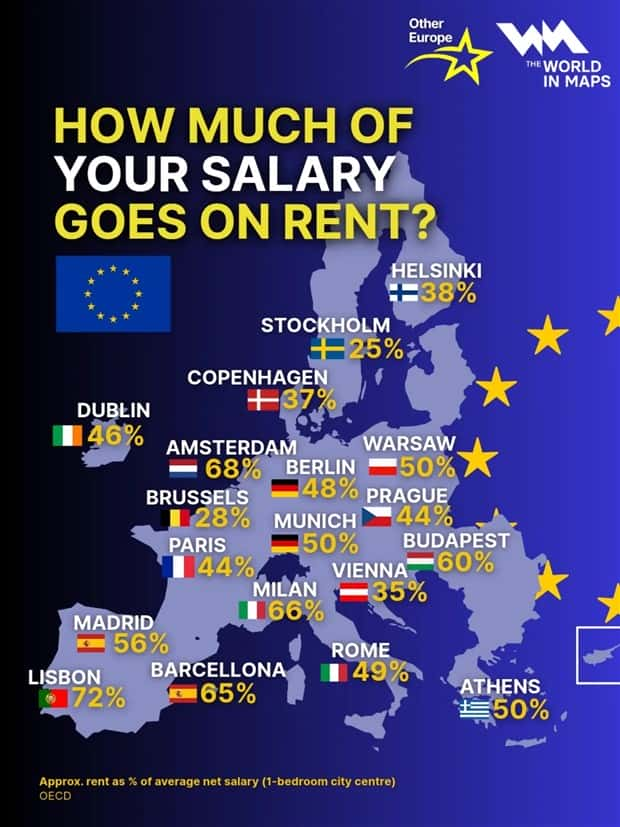
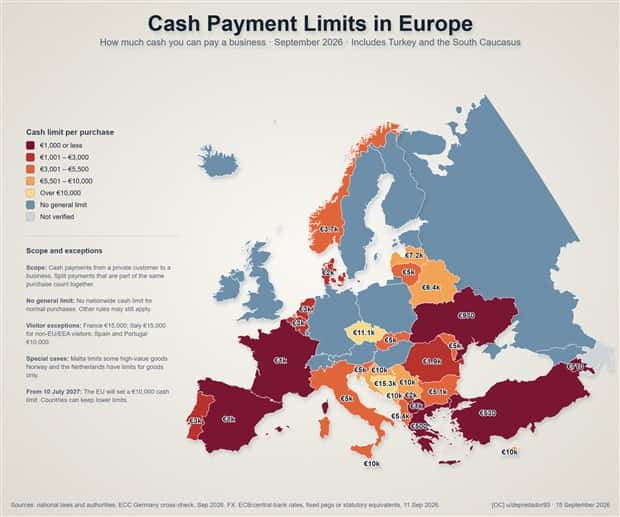
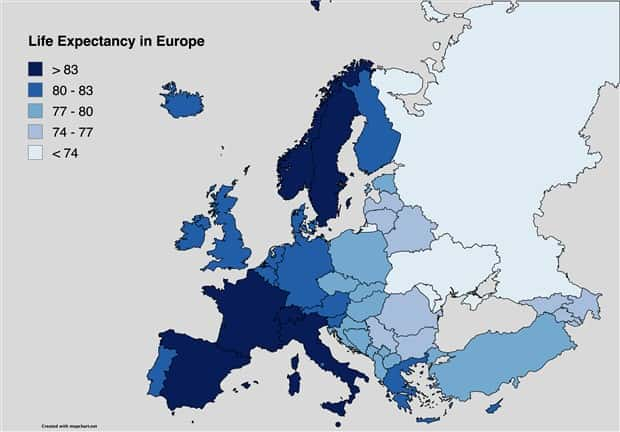
Take a look at more quirky charts and maps.



























Add comment