

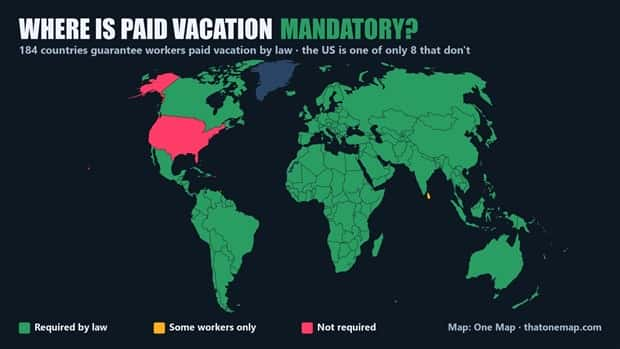
A country’s size, a city’s population, the distance between two locations, or the distribution of resources can reveal far more than expected. When presented visually, these details help explain how different parts of the planet function and what makes certain places unique. Even familiar subjects can produce surprising results when examined through actual figures.
Not all graphics are packed with serious research, either. Some highlight bizarre records, unusual proportions, or comparisons that are simply too interesting to scroll past. Others provide useful context for things most people rarely think about.
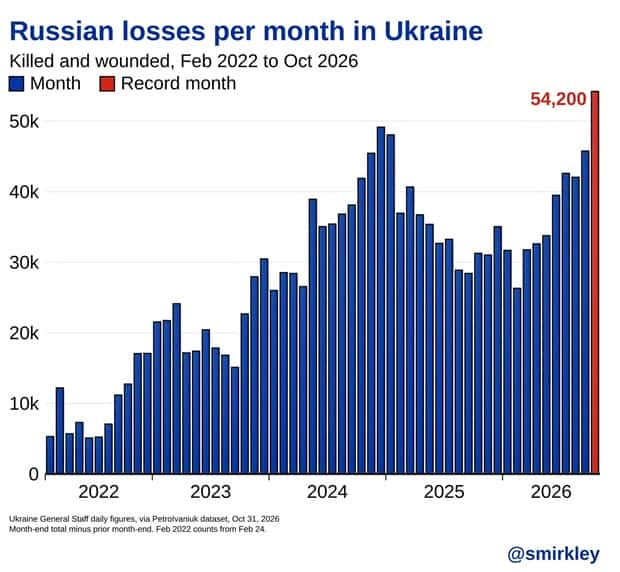
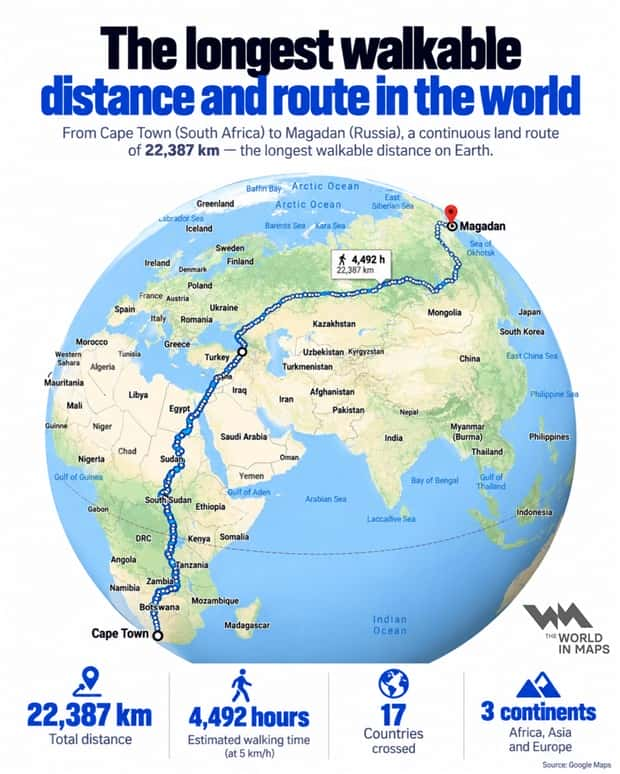
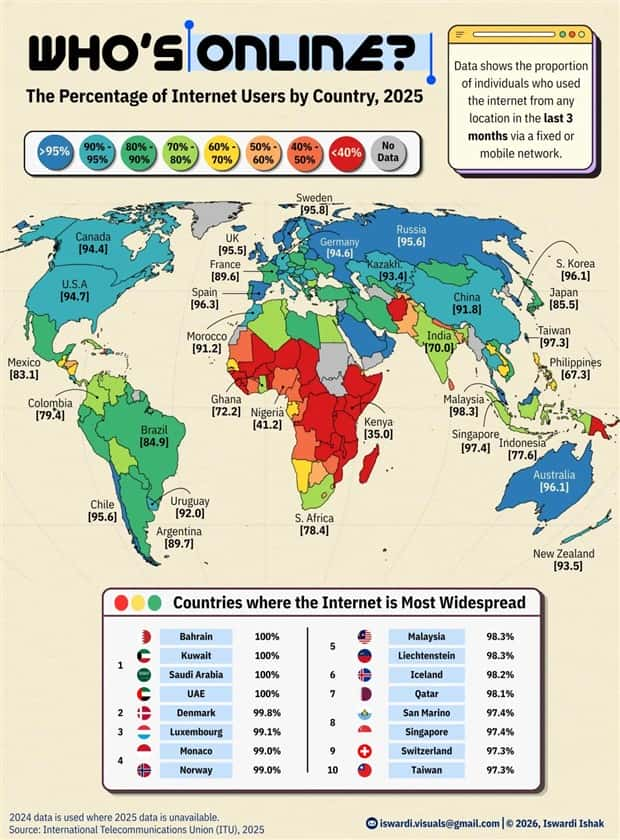
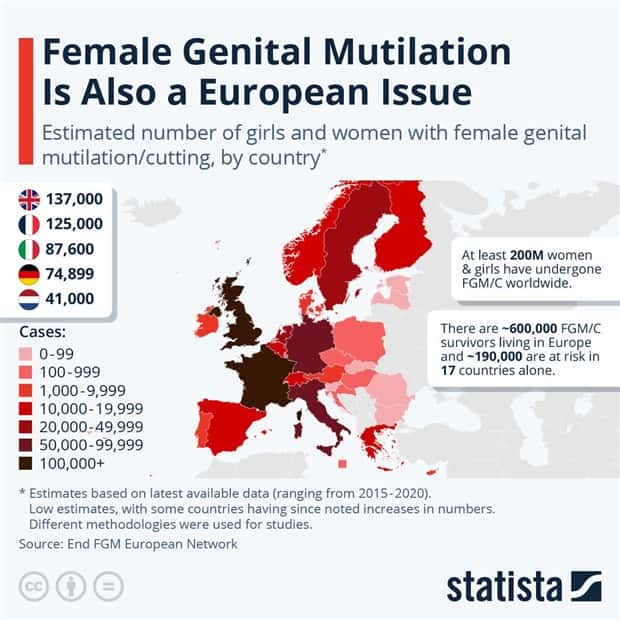
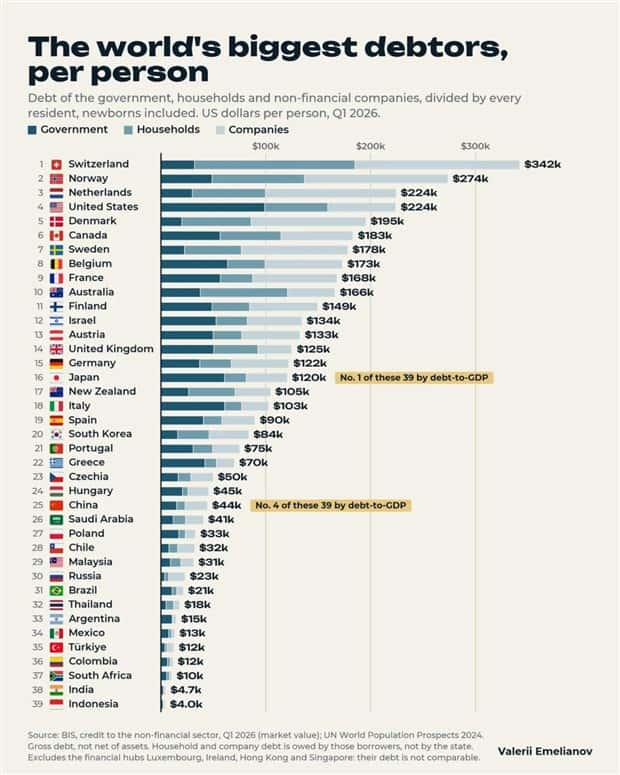
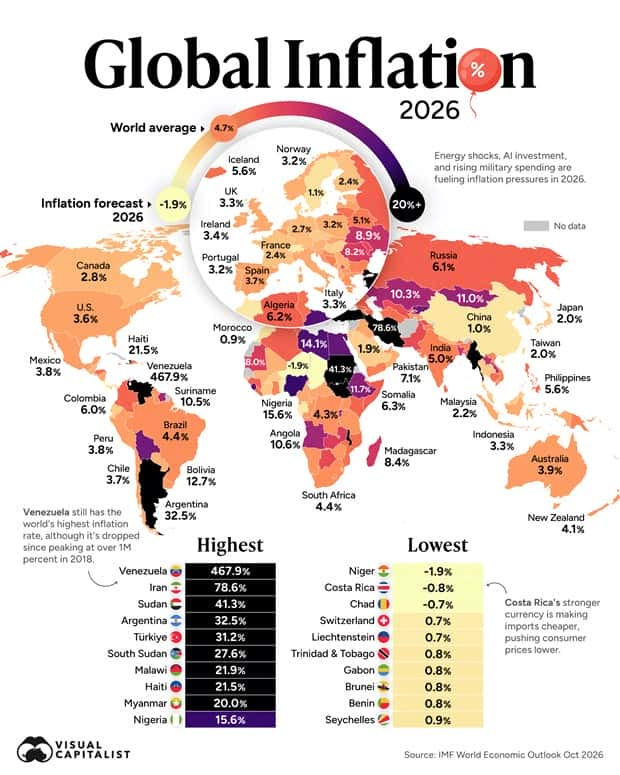
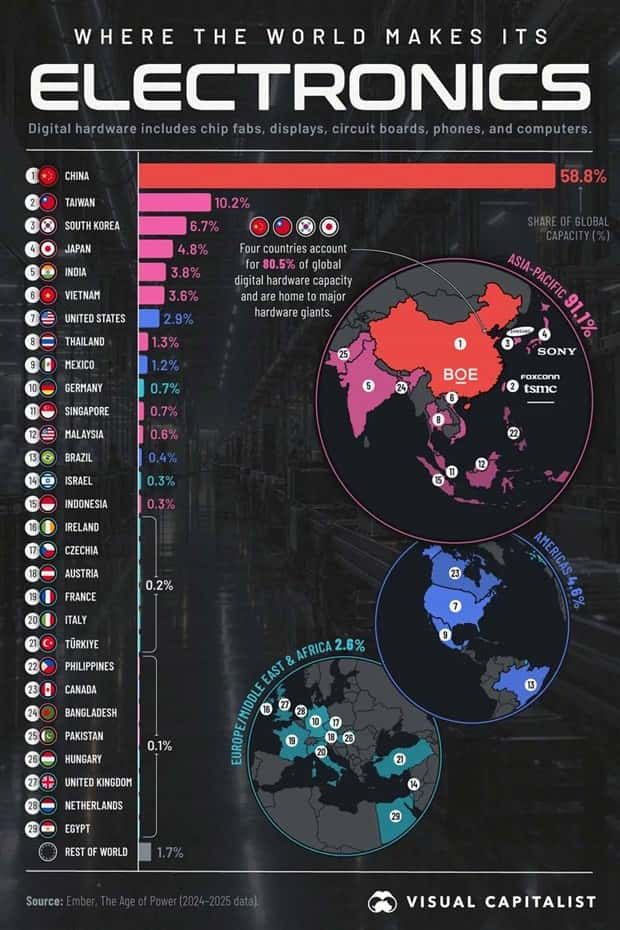
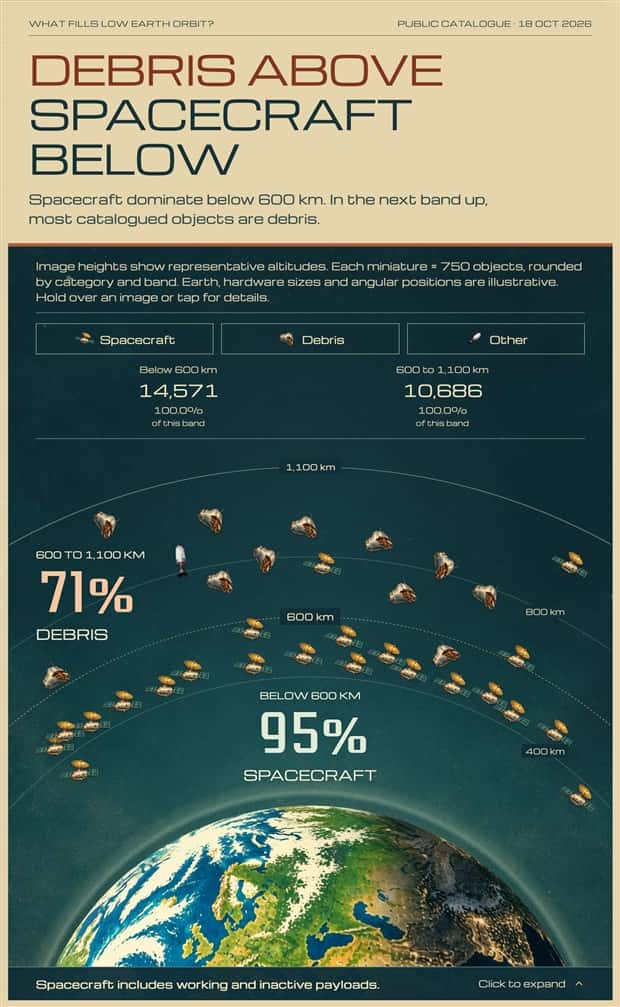
This collection of charts and maps with intriguing data features fascinating statistics, geographical oddities, and surprising visual comparisons.
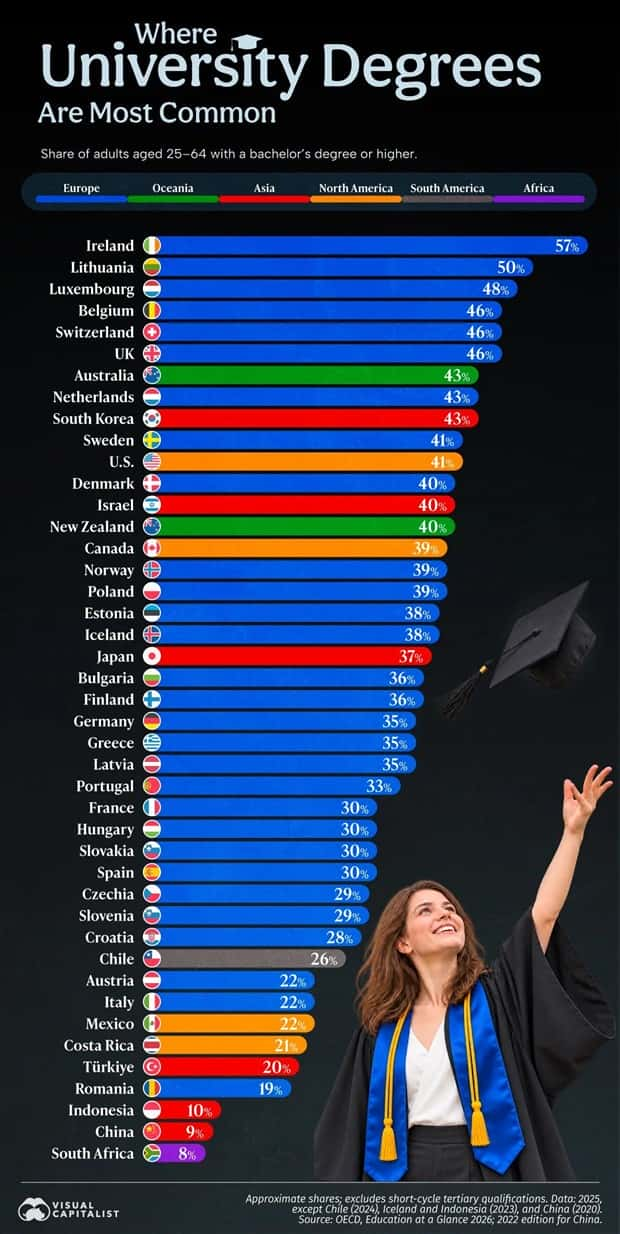
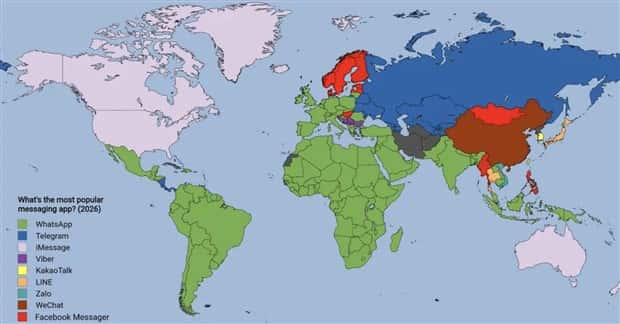
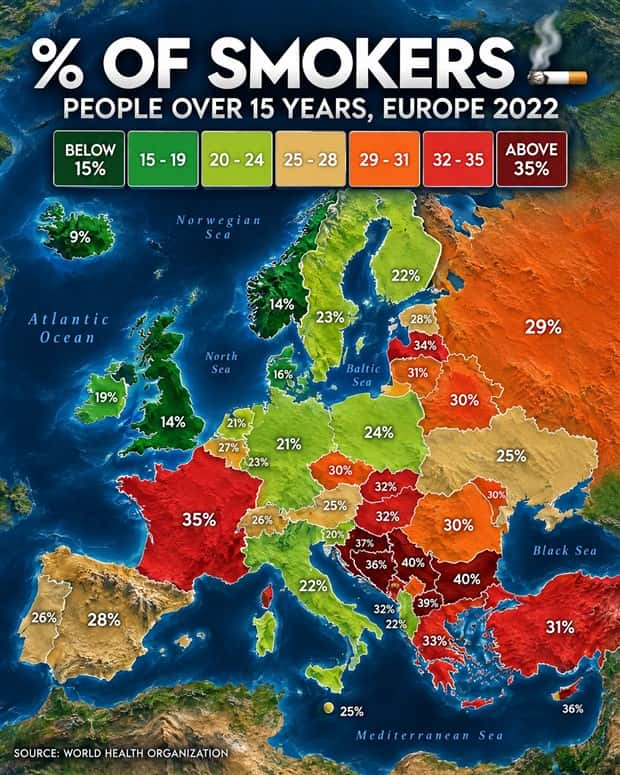
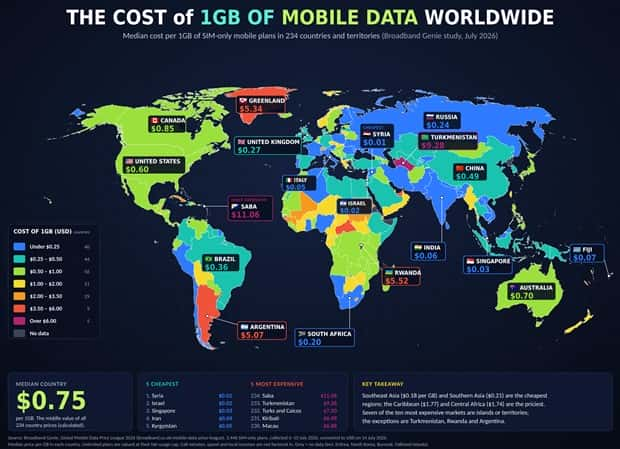
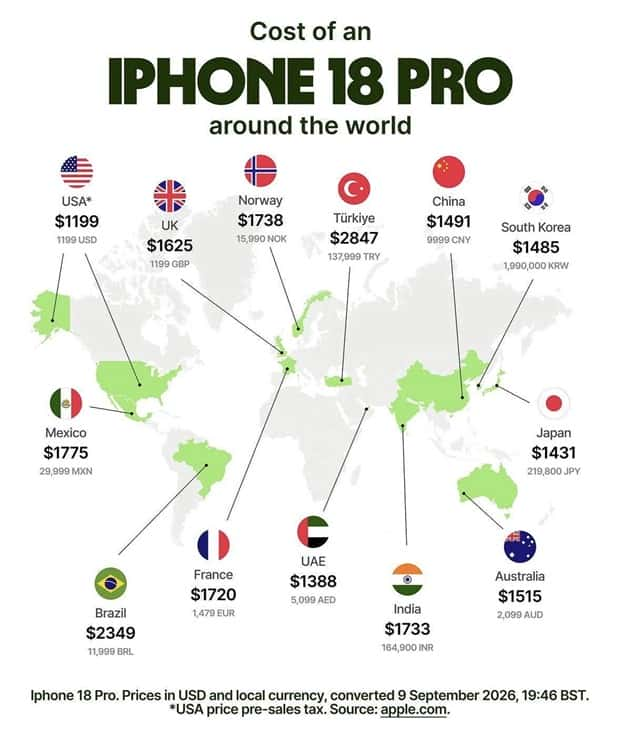
Take a look at more quirky charts and maps.


























Add comment