

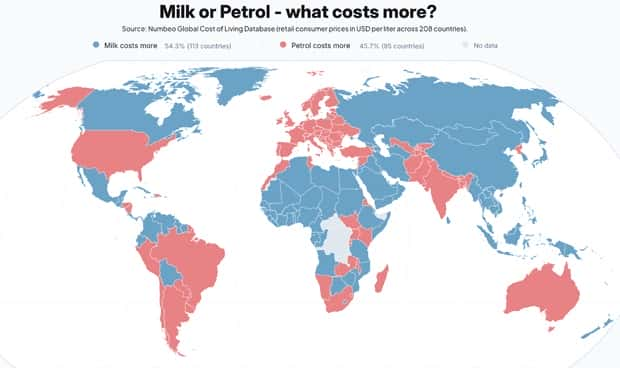
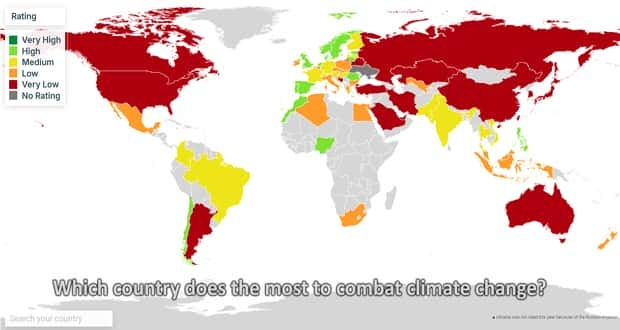
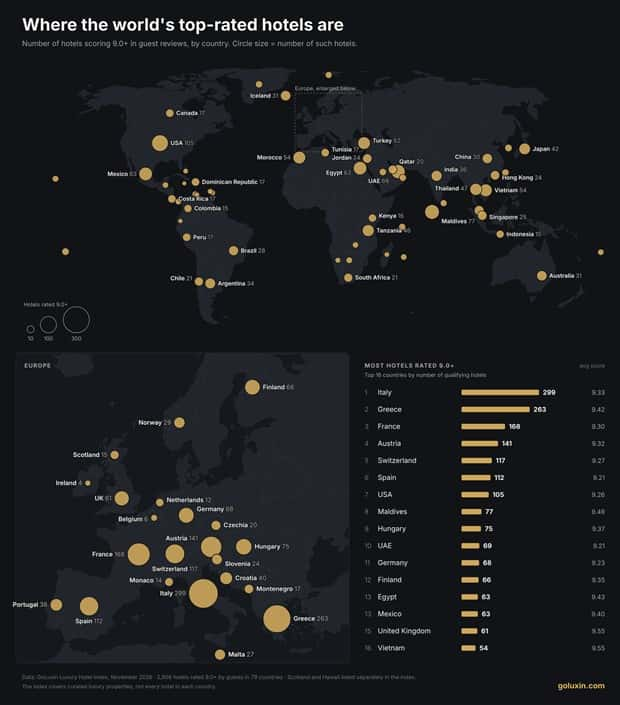
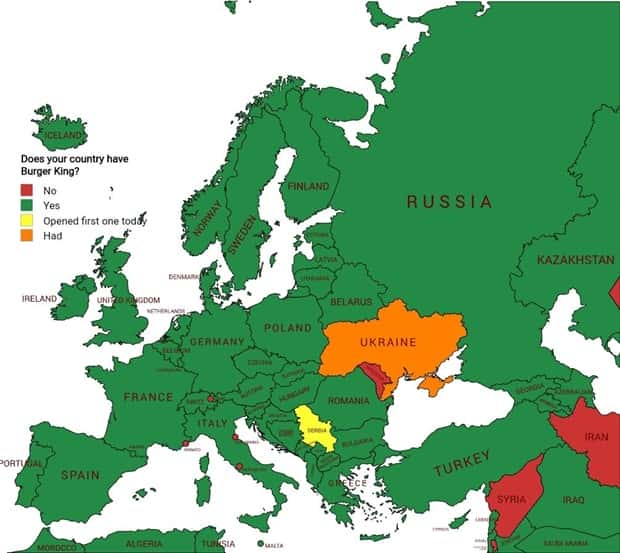
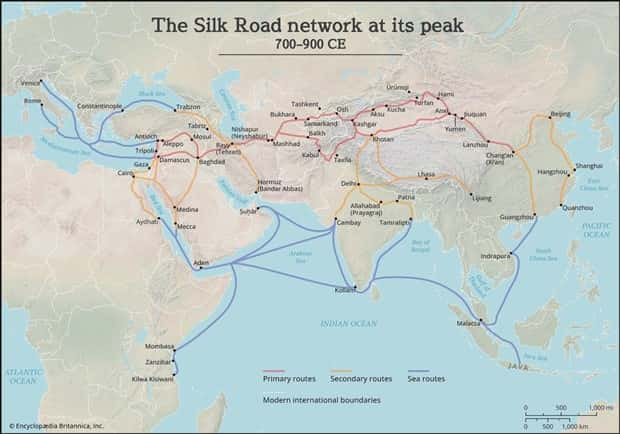
Ever wondered how much a country spends on coffee, where people live the longest, or which cities have the most unusual features? Statistics can provide answers to questions that rarely come up in everyday conversations. Presented through colorful graphics and detailed maps, even highly specific information becomes easy to follow and surprisingly entertaining.
Some entries reveal remarkable differences between places, while others expose curious trends that are easy to miss. There are rankings to question, figures to compare, and plenty of unexpected details that make you look twice.
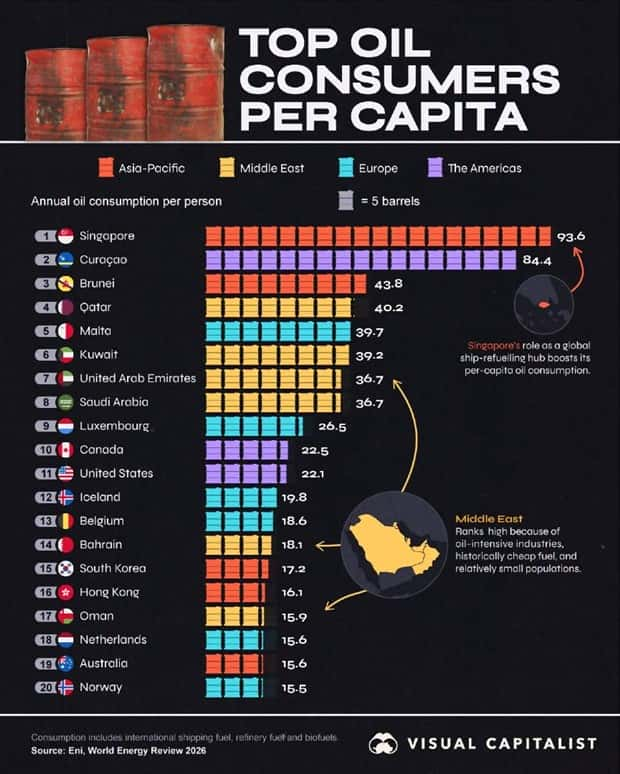
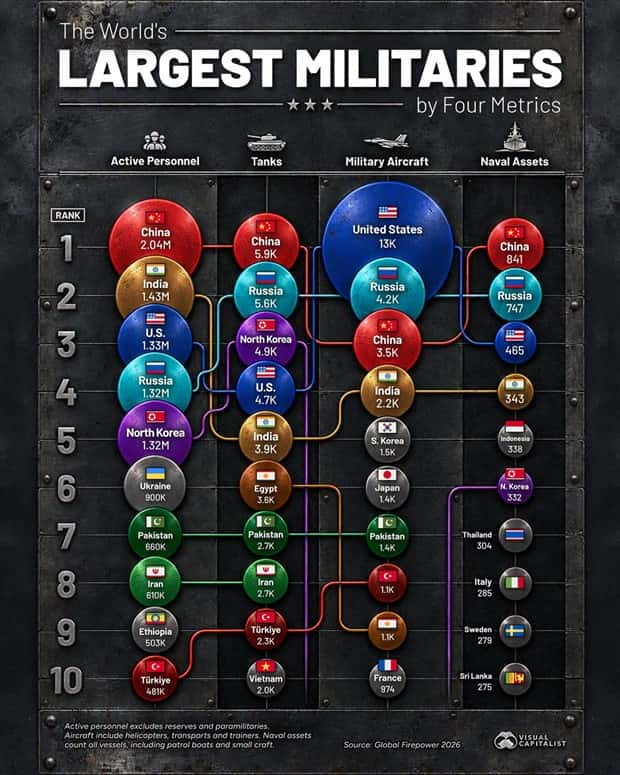
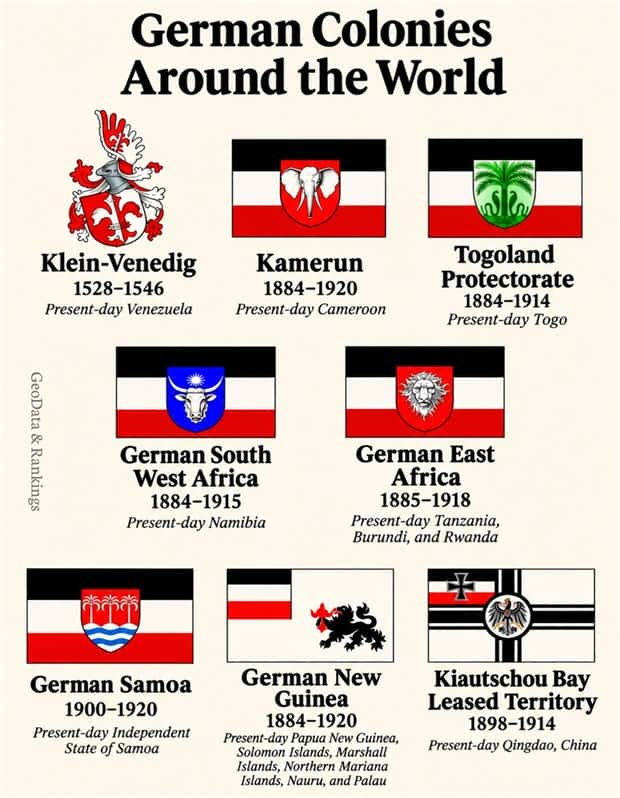
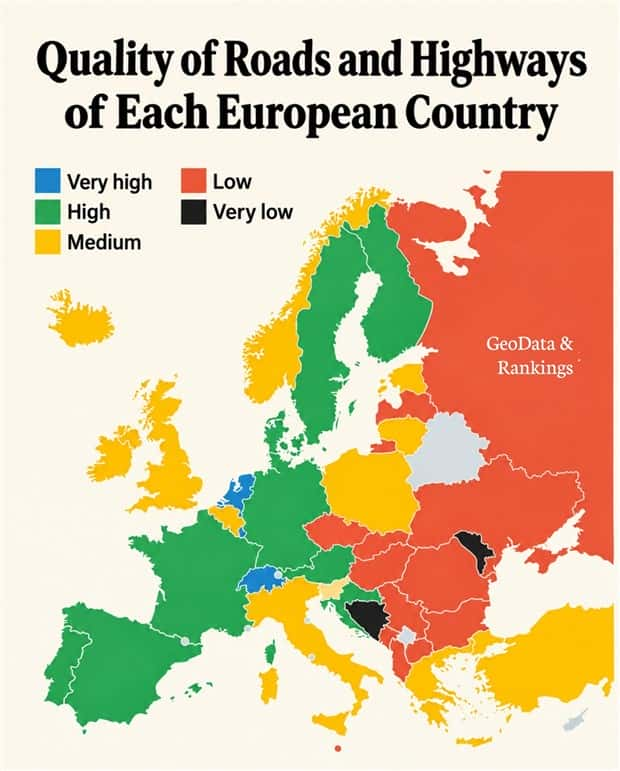
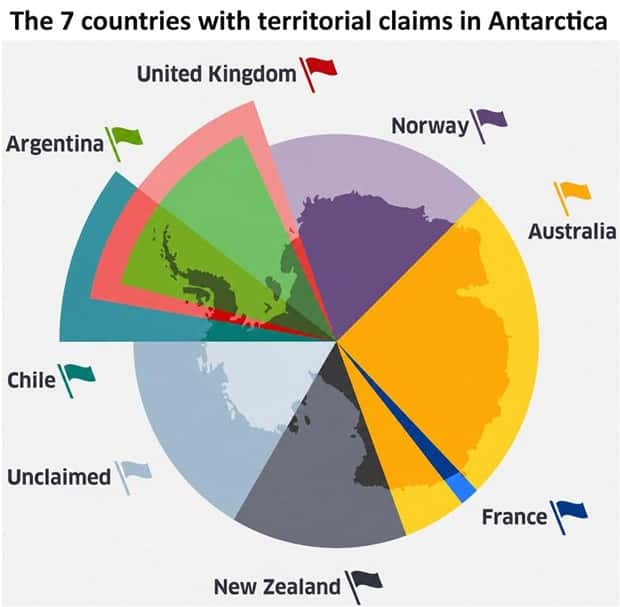
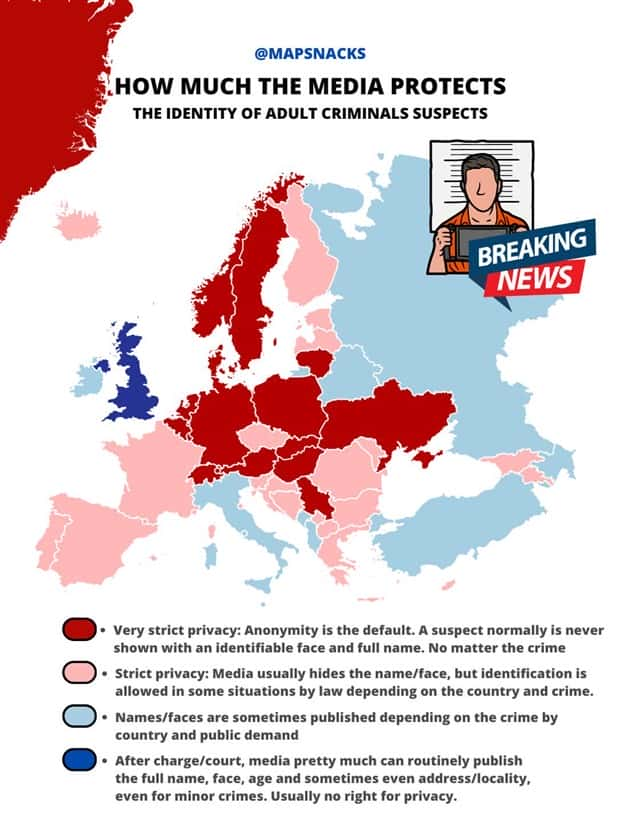
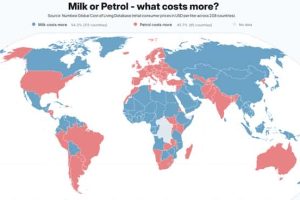
Take a look at these charts and maps with intriguing data for curious statistics, unusual rankings, and fascinating facts worth sharing. 11/13/2026
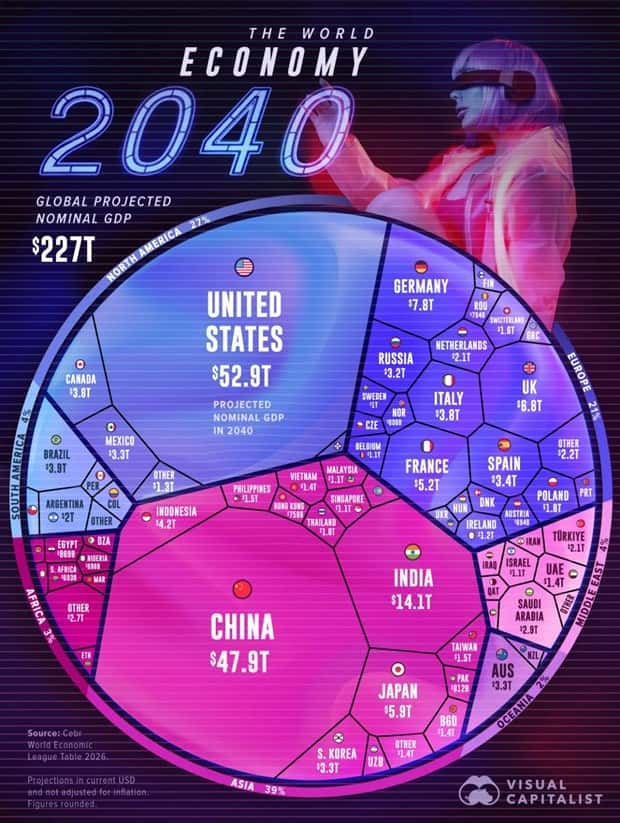
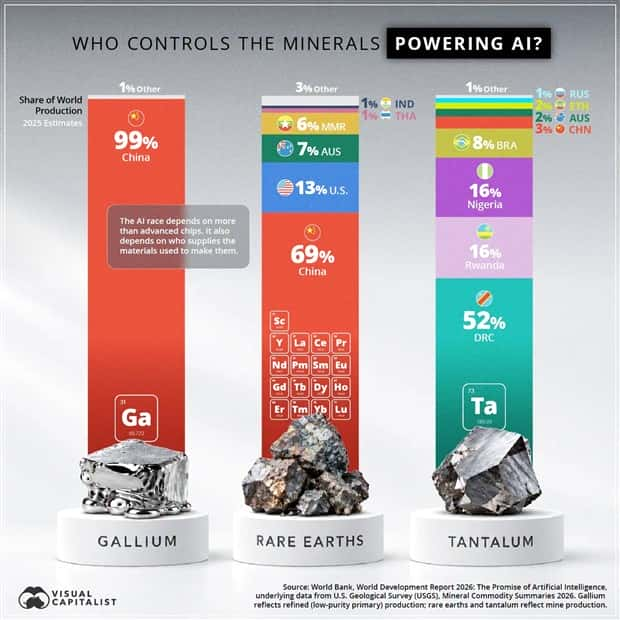
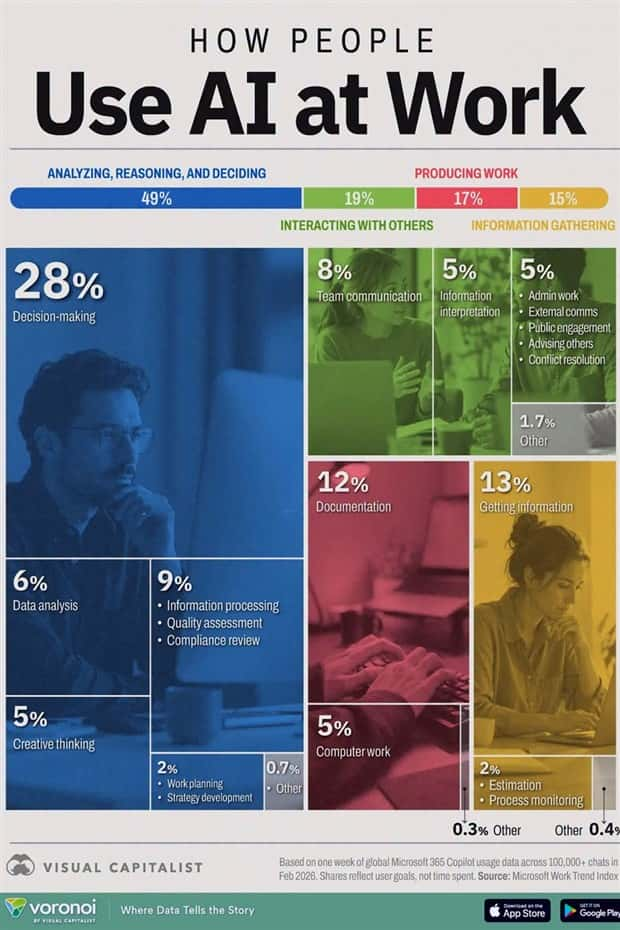


Take a look at more quirky charts and maps.



























Add comment