

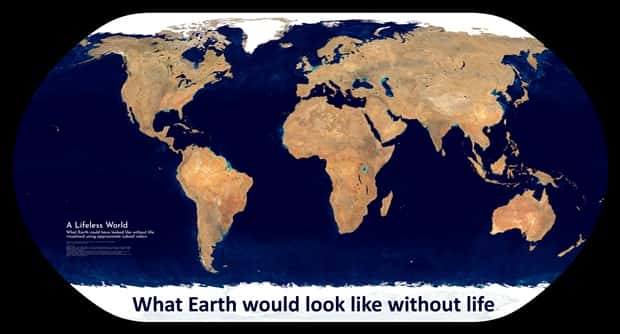
A good graphic can turn a complicated subject into something anyone can understand. Population shifts, economic patterns, environmental changes, and countless other topics become easier to grasp when facts are organized visually. Instead of digging through reports and endless paragraphs, a quick glance can reveal the bigger picture.
Of course, not every interesting graphic deals with serious matters. There are plenty of amusing statistics, bizarre geographical facts, and unexpected connections that make absolutely no sense until you see the numbers. Some are informative, others are downright ridiculous.
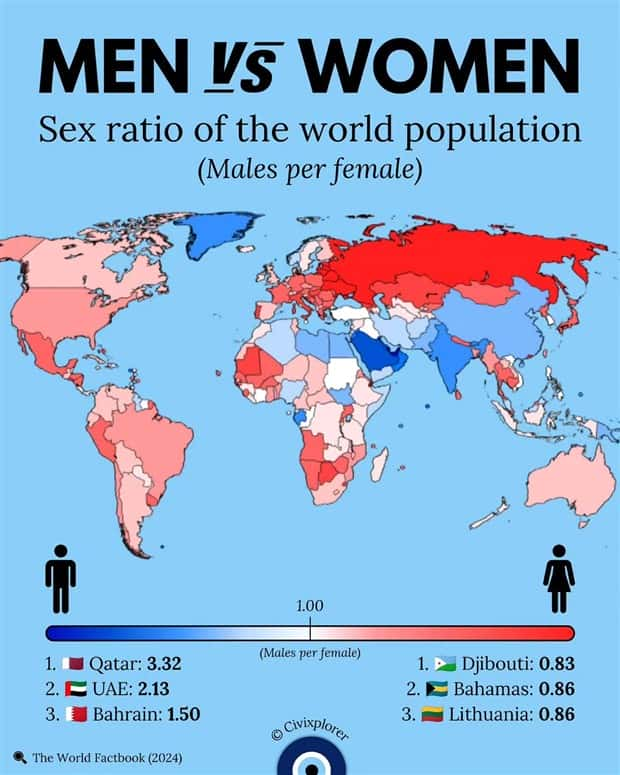
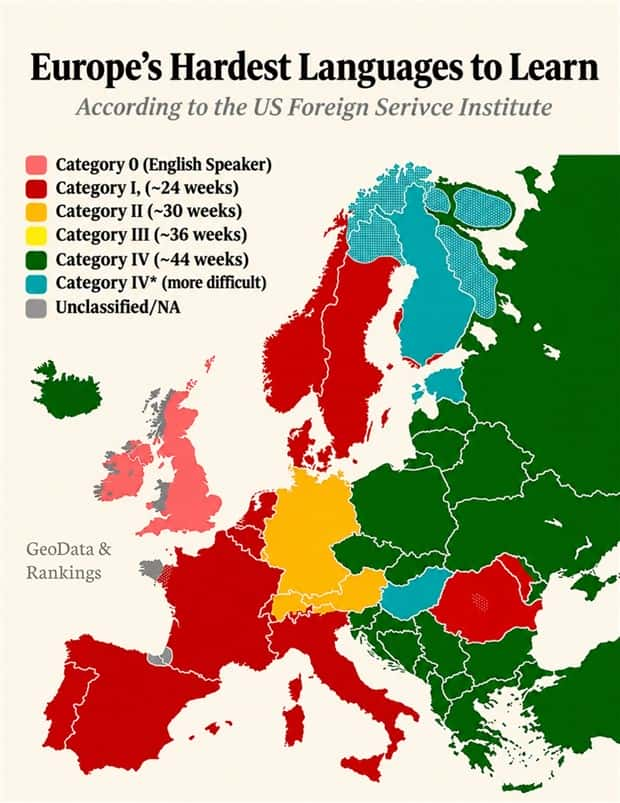
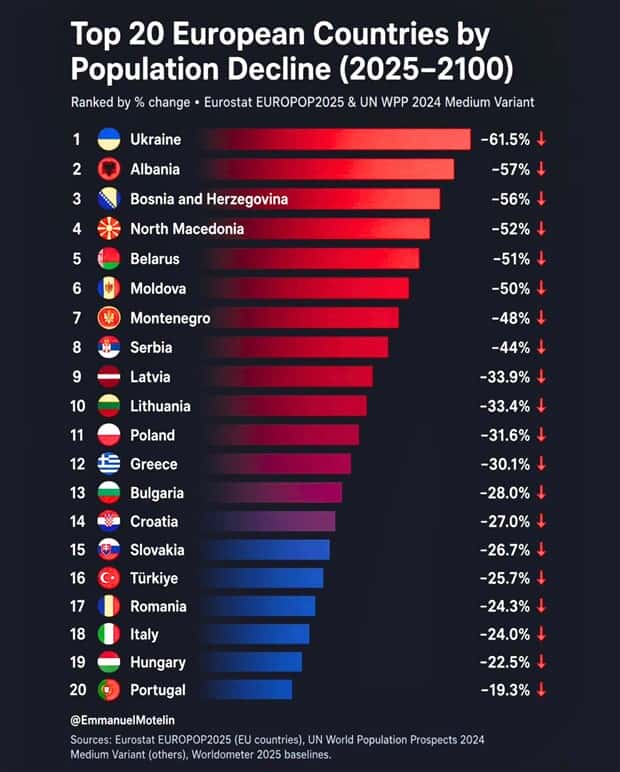
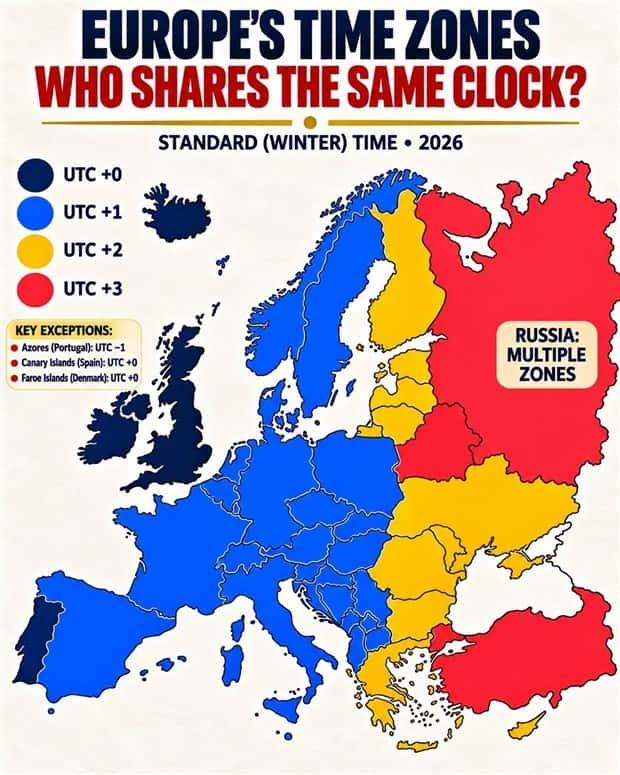
Explore these charts and maps with intriguing data for an entertaining mix of unusual information, eye-opening figures, and curious visual findings. 11/20/2026
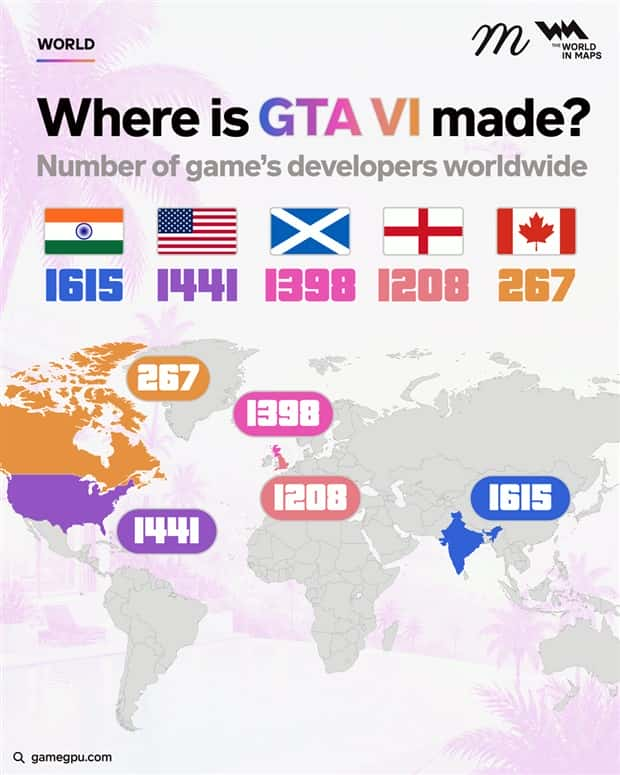
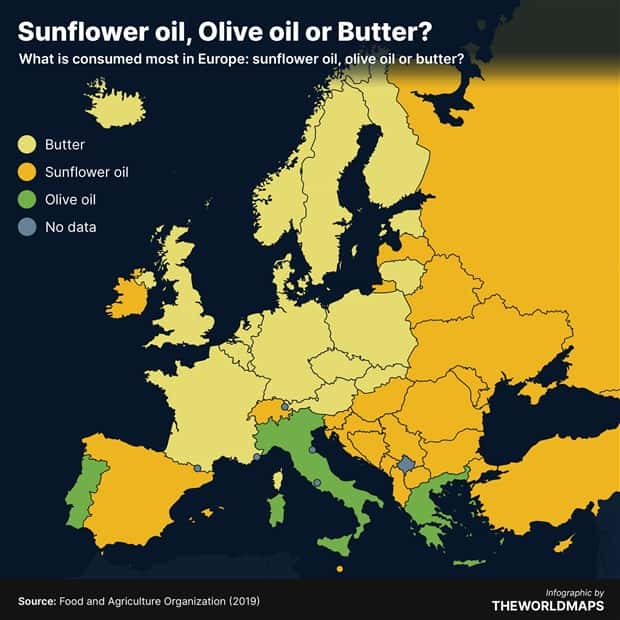
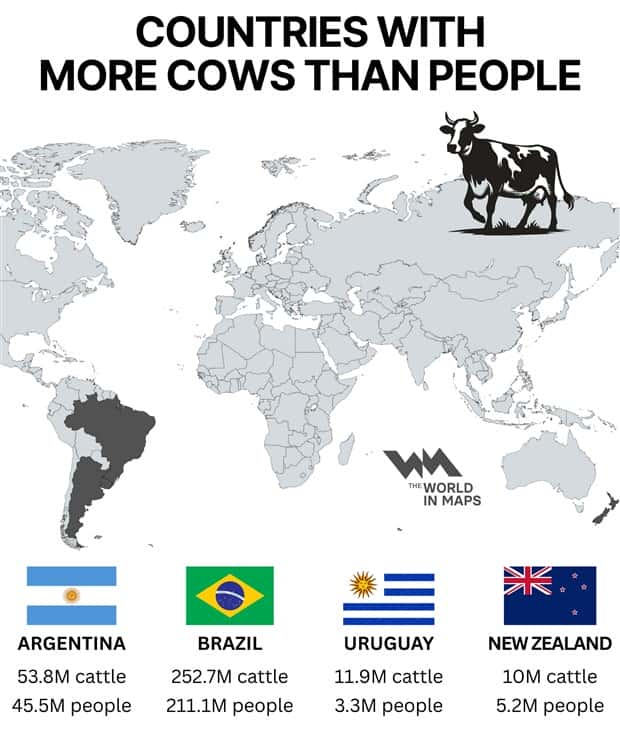
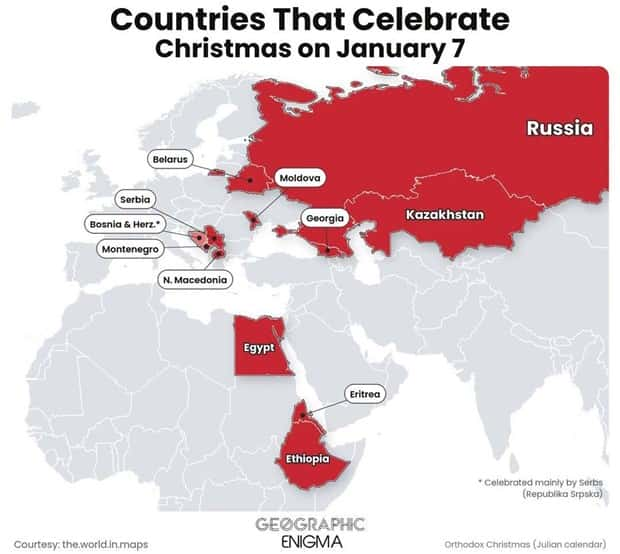
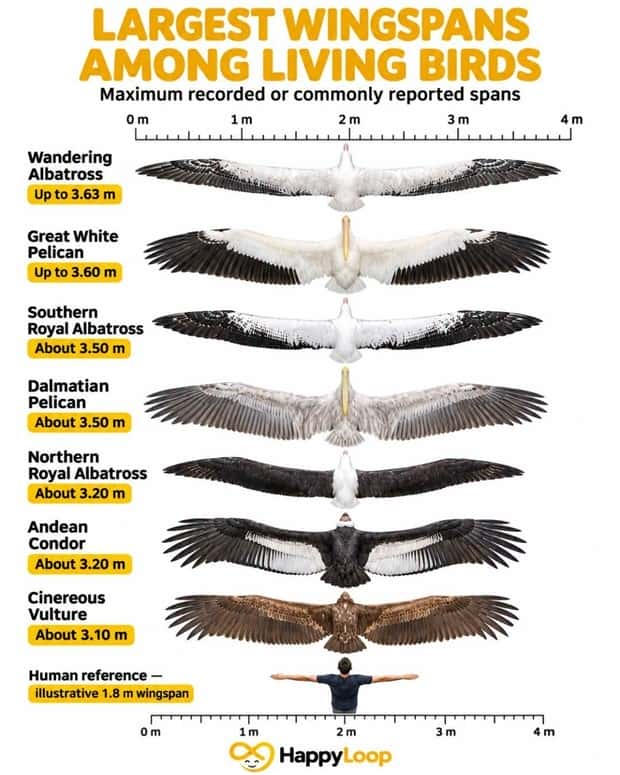
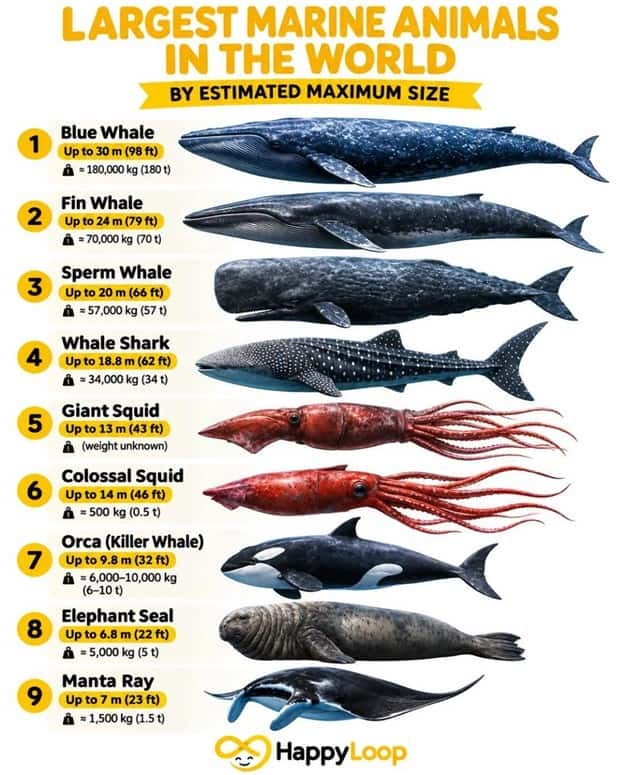
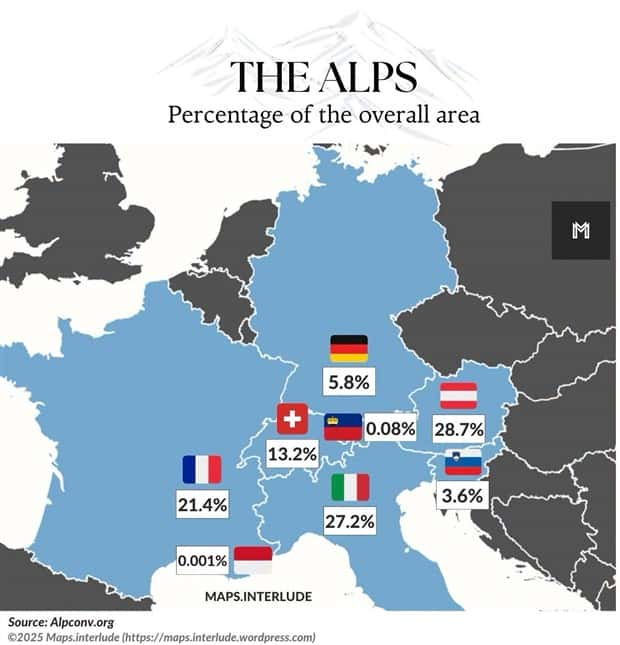
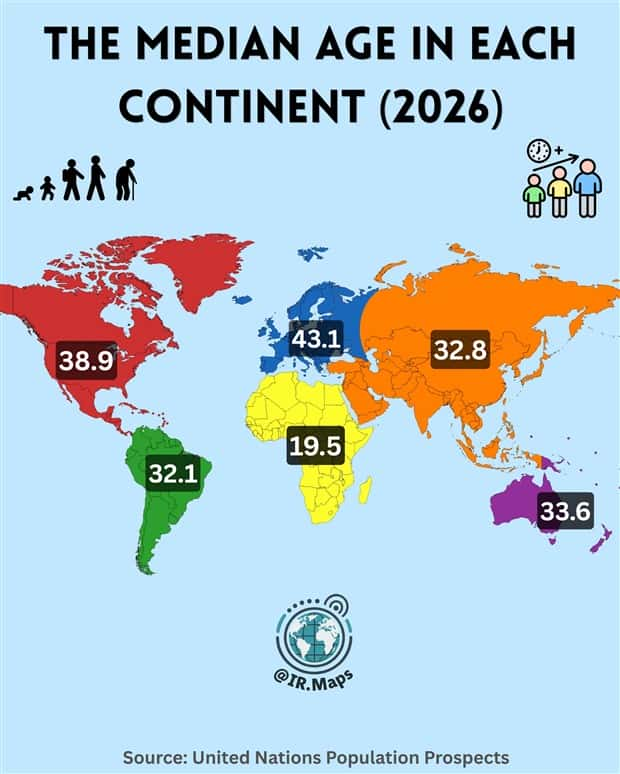
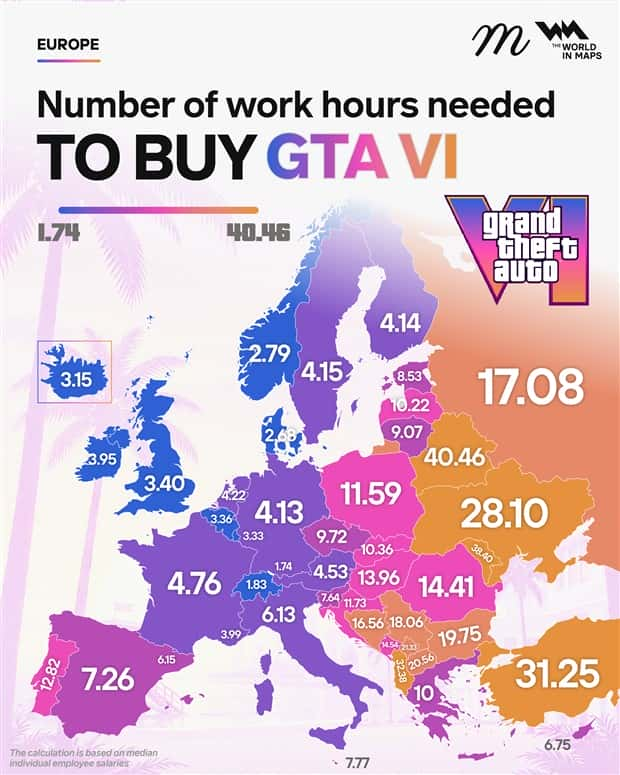
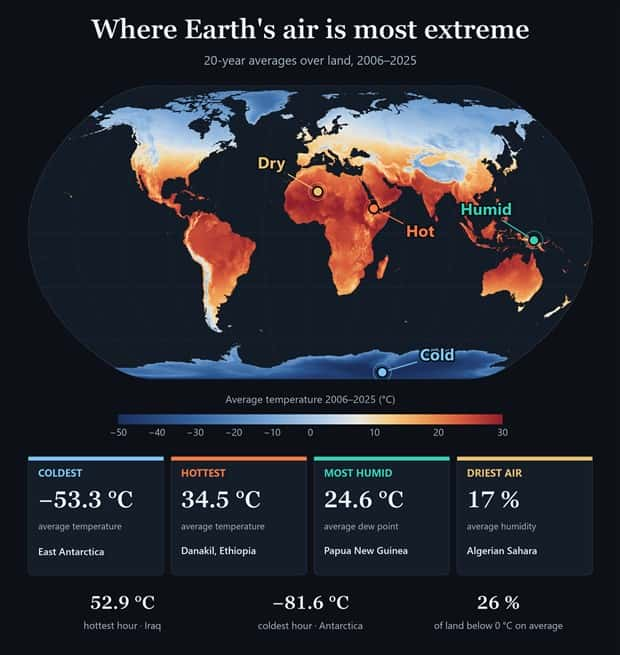
Take a look at more quirky charts and maps.



























Add comment