

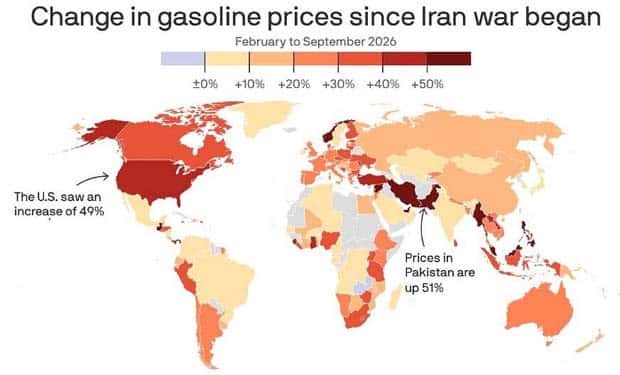
Some facts are easier to understand when they are turned into pictures. Charts and maps can make statistics clearer, comparisons more obvious, and strange little details much harder to overlook. Even familiar subjects can look completely different when the numbers are arranged in an unexpected way.
There is something oddly satisfying about spotting a pattern without having to read a long explanation. One graphic catches the eye, another makes you question the numbers, and the next might reveal a fact that was never on the radar before.
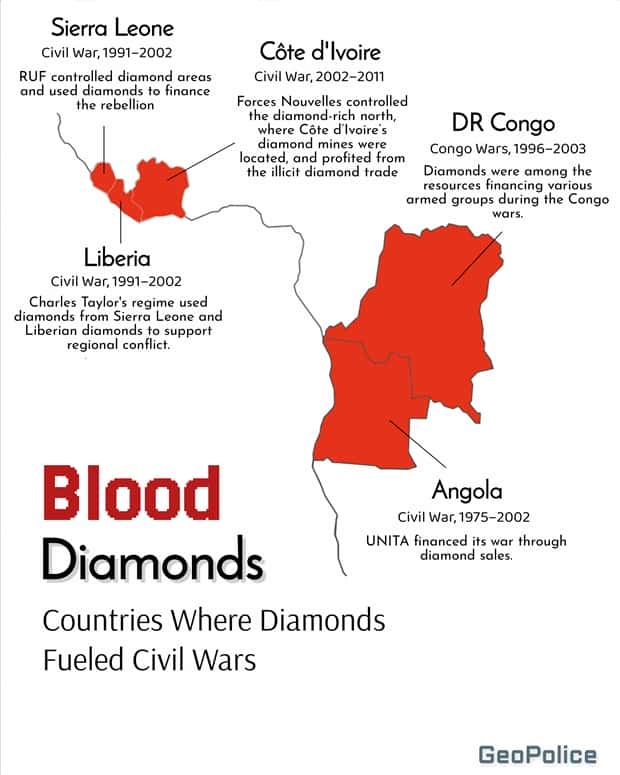
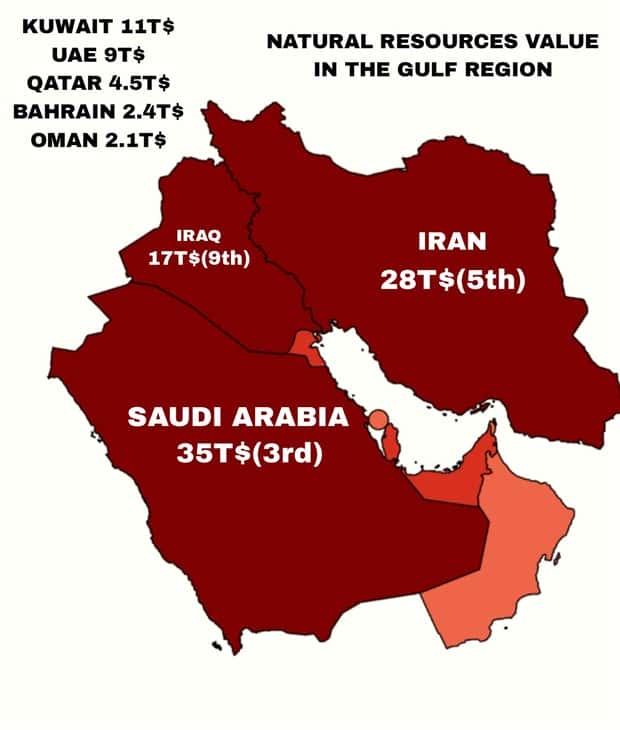
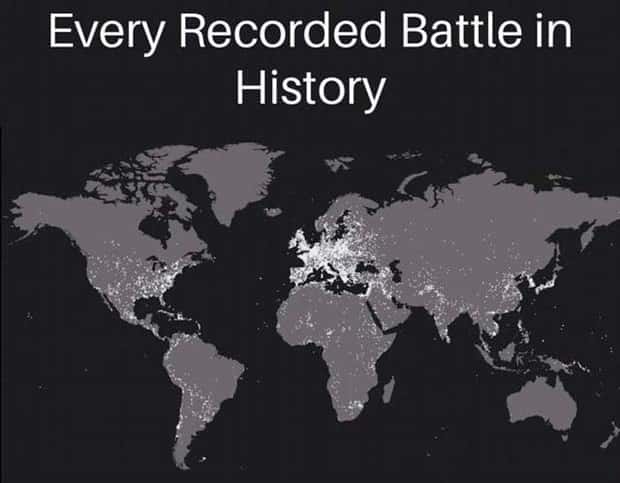
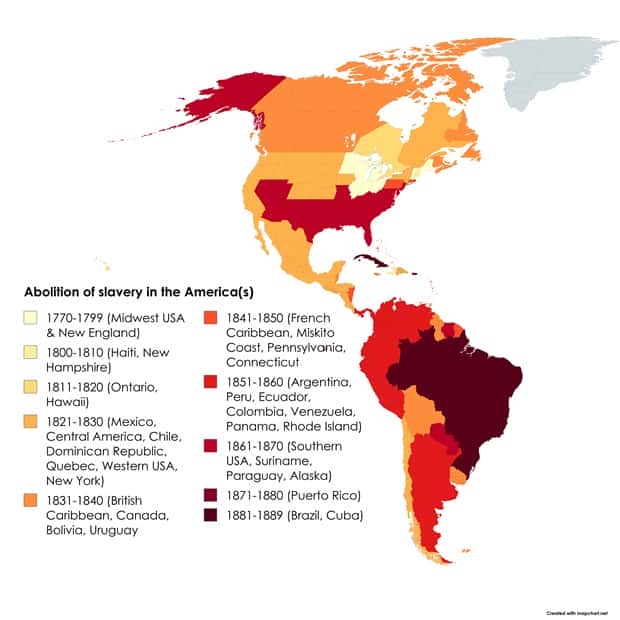
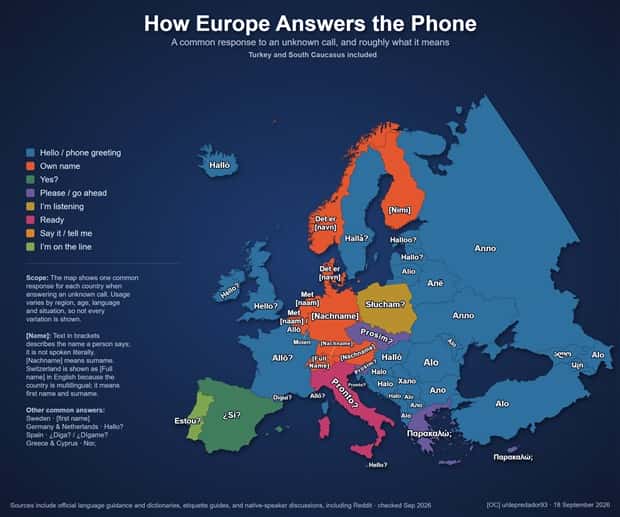
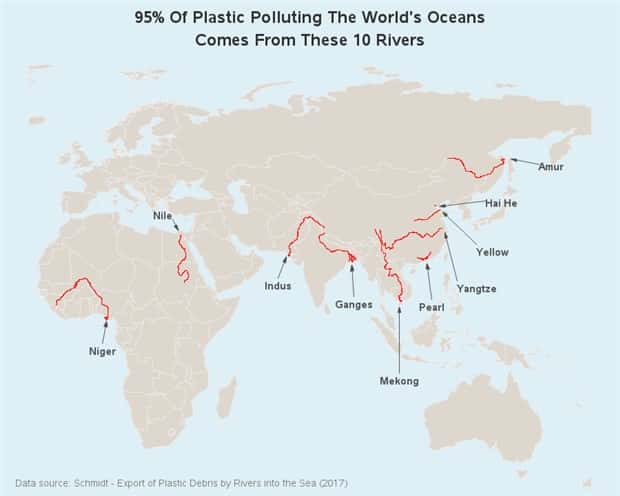
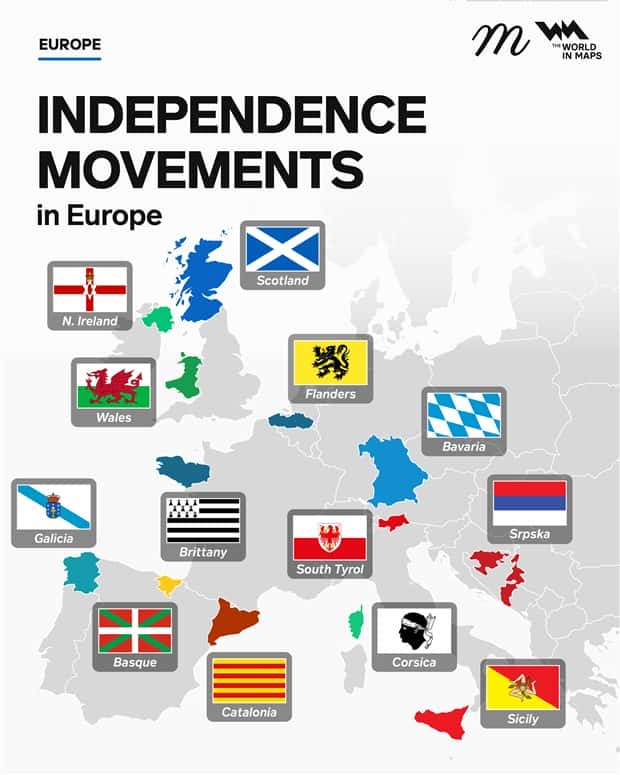
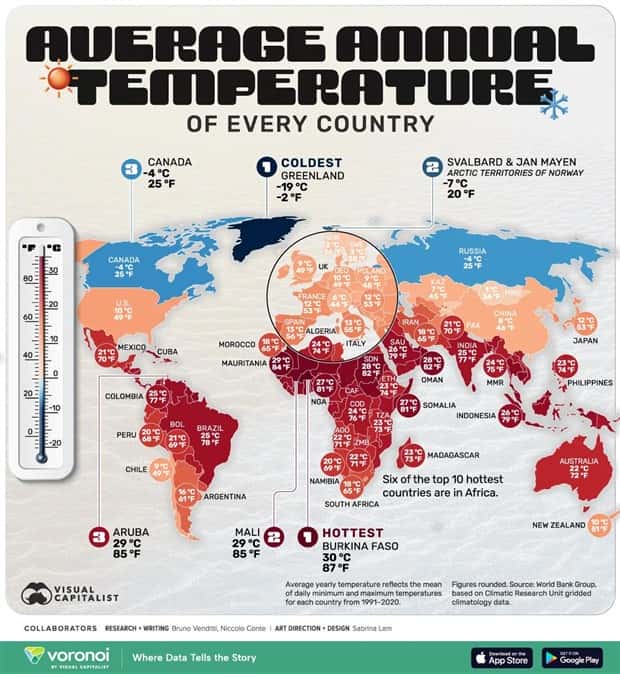
These charts and maps with intriguing data bring together unusual statistics, curious comparisons, and visual facts that are worth a closer look. 9/25/2026
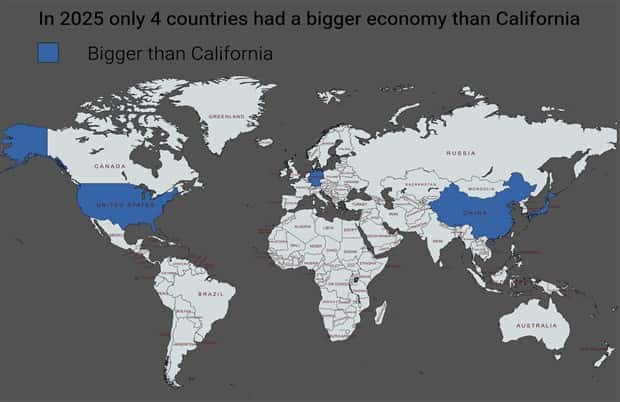
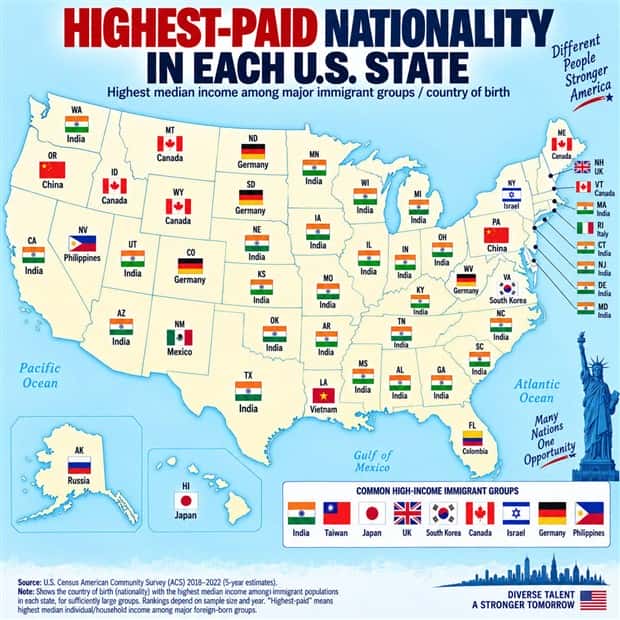
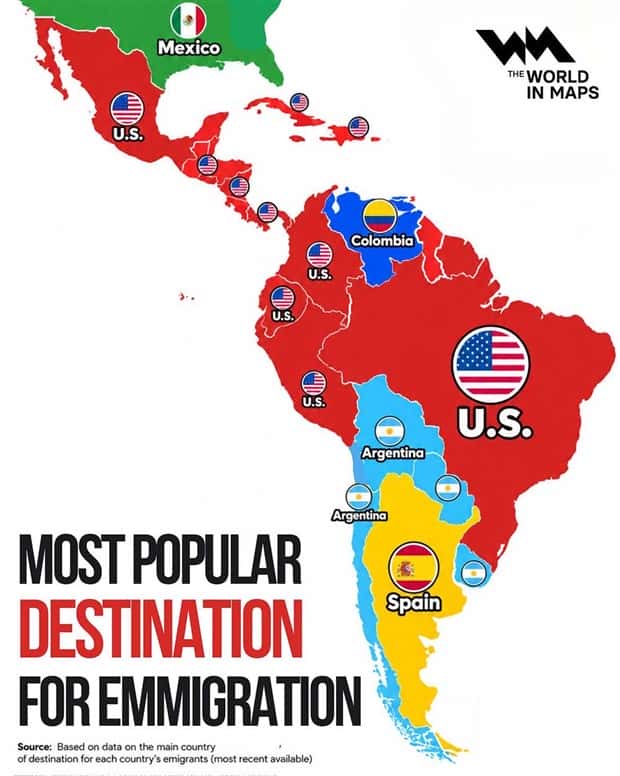
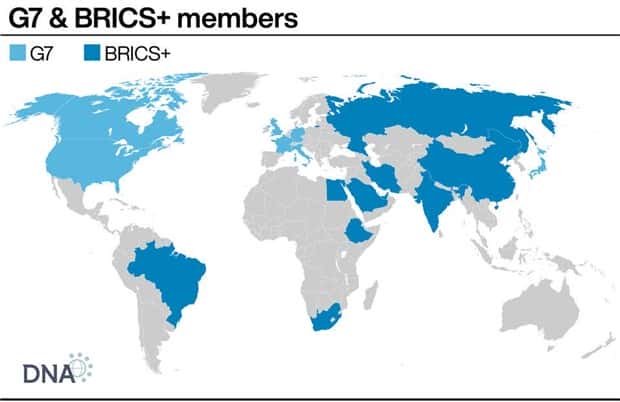
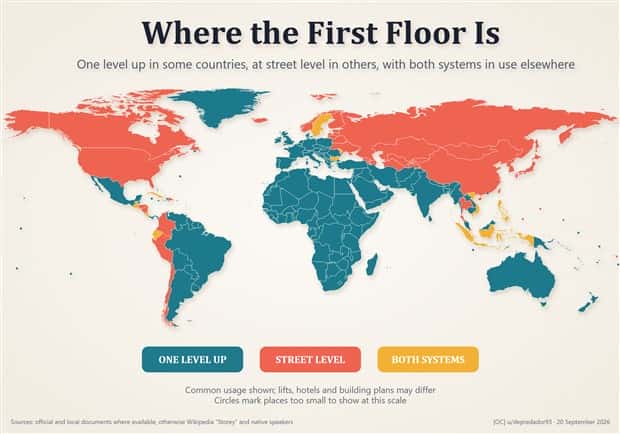
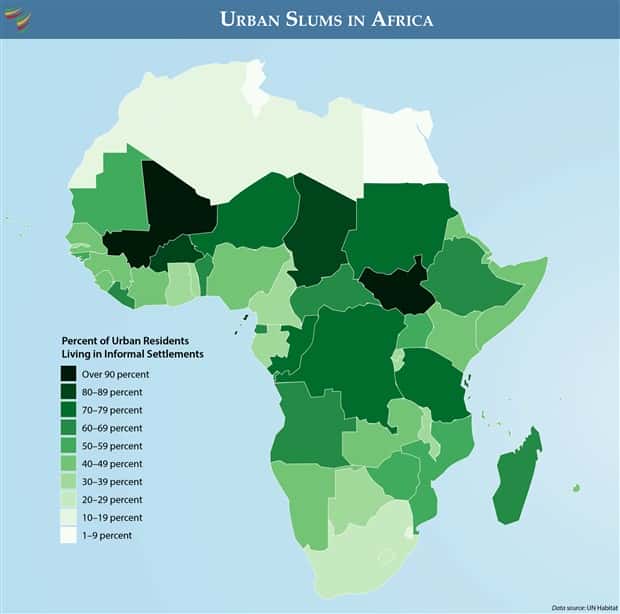
Take a look at more quirky charts and maps.


























Add comment